The problem: You wire CoinGecko into Make or Zapier, pull prices and 24-hour percentage changes, and dump them into a sheet. Now what? A number on its own tells you nothing you can act on. Is a +6% move strong or just noise? Did the whole market just flip regime, or is this one coin? So you start bolting on formulas, lookups, and filter steps to manufacture meaning by hand, then you rebuild the same logic next month when your thresholds drift. That's the trap. The data was the easy part.
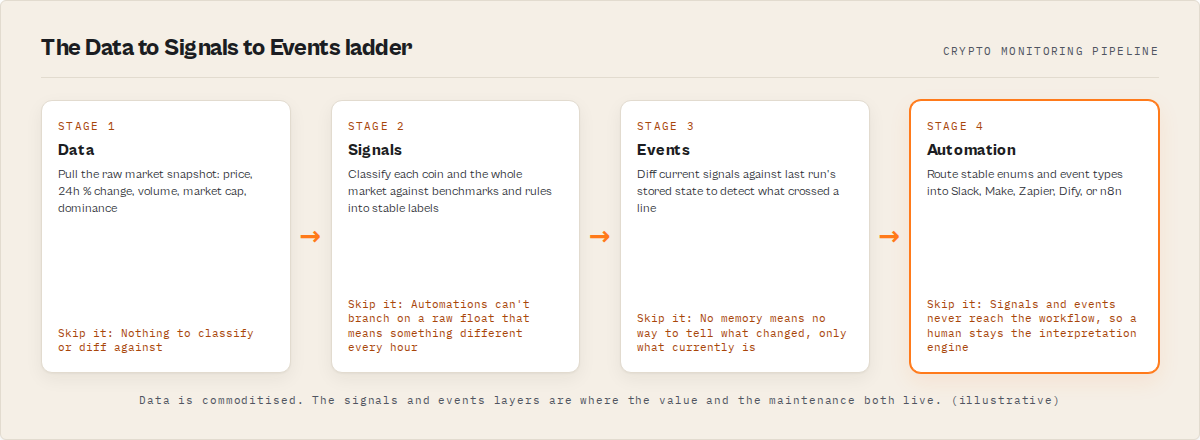
What is the difference between data, signals, and events in crypto monitoring? Data is the raw measurement (price, percentage change, market cap). A signal is an interpretation of that data (strong or weak, outperforming Bitcoin or not, what regime the market is in). An event is a detected change worth reacting to (a regime flip, a coin entering the top 25, a leadership transition). Data tells you a number; signals tell you what it means; events tell you what changed.
Why it matters: Automations can't branch on raw data. A workflow needs a stable label to switch on, not a float that means something different every hour. The valuable, hard part of crypto monitoring isn't fetching the numbers, it's the jump from data up to signals and events. Most teams stop at data and quietly become the signals layer themselves, for free, forever.
Use it when: You're building a crypto automation in Make, Zapier, Dify, or n8n, feeding a dashboard, or driving an AI agent, and you want to react to meaning and change instead of re-deriving both from a wall of numbers every run.
Data tells you a number; signals tell you what it means; events tell you what changed.
Also known as: the data-to-decision ladder, the raw-data-to-signal gap, market signal classification, crypto event detection, observation-to-action layers, the interpretation layer.
Quick answer
- What it is: three stacked layers. Data is raw market measurements; signals classify what the data means; events flag what changed since last time.
- When to use the distinction: any time you're automating off crypto market data and need something deterministic to branch on rather than a raw number.
- When it doesn't apply: one-off manual research where a human eyeballs a chart, or trading-bot execution (this is classification, not buy/sell advice).
- The typical shape: pull data, classify it into signals, diff against the last run to surface events, route events into your automation.
- The main tradeoff: moving up the ladder is genuinely hard. It needs thresholds, benchmarks, and cross-run memory that you either own and maintain or hand to a tool that does.
In this article: What it is · Why it matters · How the layers work · Output example · Alternatives · Best practices · Common mistakes · Limitations · FAQ
Key takeaways
- The one-liner. Data tells you a number; signals tell you what it means; events tell you what changed. Get those three straight and crypto monitoring stops being a triage job.
- Three layers, not one. Data, signals, and events are distinct. Conflating them is why so many crypto sheets turn into manual triage jobs.
- Data is cheap, signals and events are the value. Public APIs like CoinGecko ship the bottom layer for low or no cost. The interpretation layer is where the real work and the real cost live.
- Automations branch on enums, not floats. A stable label like
strong-uptrendor an event likeentered-top-25is something a Make or Zapier filter can switch on directly. A raw+6.2%is not. - Events require state. You can't detect "what changed" from a single snapshot. Event detection needs memory of the previous run, which is the part DIY setups almost always skip.
- Classification is not prediction. A signal describes observed data deterministically. It does not forecast price or tell you to buy. Treating the two as the same is the single biggest category error in this space.
Layers at a glance
| Layer | Question it answers | Example | Can you branch on it? |
|---|---|---|---|
| Data | "What's the number?" | BTC = $68,400, ETH 24h +4.1%, total market cap $2.4T | No, not reliably |
| Signal | "What does it mean?" | ETH strong-uptrend, relative-strength rank #3, composite score 78/100, outperforming-both | Yes |
| Event | "What changed?" | market-regime-change, SOL entered-top-25, relative-strength-upgrade | Yes, directly |
Read top to bottom and you're climbing the ladder: a raw price becomes a classification becomes a change worth reacting to. That climb is the whole game.
The same idea as a flow, source on the left, your automation on the right:
  CoinGecko ─▶ DATA ─▶ SIGNALS ─▶ EVENTS ─▶ AUTOMATION ─▶ Slack / Make / Dify
   (source)   (raw)   (meaning)  (change)   (your logic)    (where it lands)
Everything left of "automation" is the part this post is about. Most crypto monitoring setups only ever build the first arrow and then make a human do the rest.
What is the Data to Signals to Events ladder?
Definition (short version): The Data to Signals to Events ladder is a three-stage model where raw crypto market measurements (data) are classified into interpretations (signals), which are then diffed across runs to detect changes worth acting on (events).
It's a way to think about why a crypto API alone never finishes the job. Each rung adds meaning the rung below doesn't have. Data is a measurement with no opinion attached. A signal attaches an opinion grounded in rules: this coin is strong, this one is lagging Bitcoin, the broad market is in a volatile regime. An event compares now against then and fires only when something meaningful flips.
There are three categories on the ladder, and they don't collapse into each other:
- Data is the observed market state at a point in time. Prices, 24-hour and 7-day percentage moves, volume, market cap, dominance. CoinGecko, CoinMarketCap, and exchange APIs all serve this. It's commoditised.
- Signals are classifications of that data. A signal answers "what does this mean?" with a label: a market state like
strong-uptrendordowntrend, a relative-strength ranking, a 0-100 composite score, benchmark context (outperforming-both,outperforming-btc), a leadership stage, market breadth, and rally health. - Events are detected changes between runs. An event answers "what changed and what deserves attention?" from a stable vocabulary:
market-regime-change,entered-top-25,leadership-transition,relative-strength-upgrade,signal-strengthened, sector rotation.
The point of naming all three is that the value, and the difficulty, lives in the top two. The bottom rung is solved.
Why can't you act on raw crypto data?
You can't act on raw crypto data because a number carries no judgment and no context. A +6% move means one thing in a calm market and another in a crash. An automation needs a stable label to branch on, and raw data forces you to manufacture that label yourself on every single run.
Think about what a real workflow step needs. A Zapier filter or Make router switches on a condition: if state equals X, do Y. Feed it priceChange24h = 6.2 and there's no clean branch, because 6.2 isn't strong or weak on its own. You'd need to compare it against the coin's own history, against Bitcoin, against the whole market, then pick a threshold, then defend that threshold when it drifts.
That comparison work is the signals layer. And it's not a one-time formula. Benchmarks move, market regimes shift, and a threshold that flagged "strong" in a bull market flags everything in a mania. The reason teams drown isn't a lack of data. It's that they've quietly volunteered to be the interpretation engine, by hand, on a schedule.
The spreadsheet death spiral
Almost every DIY crypto monitoring setup dies the same death, and it always starts so reasonably.
Day one, it's clean. CoinGecko into a Google Sheet, one tab, a column of prices. Lovely. Then you want to know if a coin is actually strong, so you add a relative-strength column. Then "strong compared to what?", so you add a benchmark column pinned to Bitcoin. Then you want a leaderboard, so there's a ranking tab. Then you want to be told instead of looking, so there's an alert rule. Each step is twenty minutes and feels like progress.
Six months later you're 20 tabs deep. There's the live tab, the archive tab, the "old thresholds (do not delete)" tab, three ranking tabs from three different times you changed your mind, and a tab whose entire job is reconciling the other tabs. The alert rule fires at 3am over nothing. The thresholds were tuned in a market that no longer exists. And the worst part: nobody trusts the numbers anymore, so you end up eyeballing the raw prices again, which is exactly where you started, except now there's also a spreadsheet to maintain.
That's the spiral. It isn't a skill problem and it isn't laziness. It's that a spreadsheet has no memory of why a threshold was set, no concept of regime, and no way to tell you what changed versus what merely is. Every fix adds surface area, and surface area is the thing eating your weekends. The DIY path doesn't fail because the math is hard. It fails because the maintenance is forever.
Why most crypto alerts fail
Most crypto alerts fail because they fire on raw data instead of meaning. "BTC +4%" lands in your phone and your honest reaction is "so what?" Four percent is a yawn in one regime and a screaming top in another, and the alert can't tell the difference because it never knew the difference.
Compare the two:
- "BTC +4%" -- a number with no context. You still have to go look, check the regime, check whether it's leading or lagging, and decide if it matters. The alert did none of the work. It just interrupted you.
- "Market regime changed: neutral to risk-on" -- meaning. That one sentence tells you the whole market just shifted character, which is a thing you'd actually rearrange your day for.
A good crypto alert isn't a faster price ticker. It's a notification that something changed in a way worth your attention, and that only exists once you're firing on events instead of on raw moves. An alert built on data is noise with a notification badge. An alert built on events is a reason to look. Most setups never make that jump, which is why people mute their own crypto alerts within a month.
How do the three layers work in practice?
In practice each layer feeds the next: data is fetched, signals are computed by classifying that data against benchmarks and rules, and events are produced by comparing the current signals against the previous run's stored state. The output an automation consumes is the signals and the events, not the raw data underneath.
Here's the mechanism, conceptually, without the build-it-yourself recipe:
- Fetch the data. Pull the current market snapshot: top coins by market cap, their price moves, volume, dominance figures. This is the commoditised rung.
- Classify into signals. Each coin gets scored and labelled against Bitcoin and against the broad market. The whole market gets a regime classification, a breadth read, and a health read. This is where rules, benchmarks, and calibration live, and it's the part that quietly eats engineering time if you own it.
- Detect events by diffing state. The current classification is compared against what was stored last run. If a coin crossed into the top 25, if the market regime flipped, if a coin's relative strength was upgraded, an event fires from a fixed vocabulary. No previous state, no events.
- Route the output. Signals and events land in your automation as stable enums. A Make scenario, Zapier zap, Dify workflow, n8n flow, or dashboard branches on them directly.
The hard rungs are the middle and the top. The CoinGecko Crypto Market Intelligence Apify actor (ryanclinton/coingecko-crypto-data) exists to own those two rungs for you, so your workflow consumes signals and events instead of re-deriving them. CoinGecko gives you data. This actor gives you signals and events.
Why are events the hard part?
Signals and events look like siblings, but they are not equally hard to produce, and the gap between them is the whole moat.
A signal can be computed from a single snapshot. Hand a tool today's prices and it can label a coin strong-uptrend, rank its relative strength, and score the market. One read of the data is enough. That is why most crypto tools can do signals at all: they are stateless, and a stateless tool can tell you what is true right now.
An event cannot be computed from a single snapshot, because an event is a difference. entered-top-25, leadership-transition, market-regime-change, relative-strength-upgrade only mean anything relative to a previous run. To produce one, something has to remember what last run looked like, compare it to now, and decide what crossed a line. That requires state.
Most crypto tools are stateless. They can tell you what is true. They cannot tell you what changed.
That is the line worth internalising, because "what changed" is almost always the thing you actually want to act on. And the memory that makes it possible is its own ongoing job: storing each run, diffing the new state against the old, bounding how much history to keep, handling the first run when there is nothing to compare against, and keeping a named watchlist so longitudinal context like leadership over time can accumulate. A signal calculation can be cloned in a weekend. Six months of accumulated cross-run memory cannot, because it only exists if you have been running and remembering the whole time. State is the moat, and it is the rung DIY setups skip first.
What does a signals and events output look like?
A signals and events output is a structured object where every field is a stable label or score an automation can switch on, not a raw float you have to interpret. Here's the shape an automation would branch on (illustrative values):
{
  "market": {
    "regime": "risk-on",
    "marketState": "strong-uptrend",
    "breadth": "broad",
    "health": "healthy",
    "compositeScore": 74
  },
  "coins": [
    {
      "symbol": "ETH",
      "marketState": "strong-uptrend",
      "relativeStrengthRank": 3,
      "compositeScore": 78,
      "benchmarkContext": "outperforming-both",
      "leadershipStage": "leading"
    }
  ],
  "events": [
    { "type": "market-regime-change", "detail": "neutral -> risk-on" },
    { "type": "entered-top-25", "symbol": "SOL" },
    { "type": "relative-strength-upgrade", "symbol": "ETH" }
  ],
  "watchlist": { "tracked": ["ETH", "SOL", "BTC"], "carriedFromLastRun": true }
}
Notice what you'd switch on in a workflow: regime, marketState, benchmarkContext, and the events[].type enum. Those are the branch conditions. The raw price that produced them isn't in the part your automation reacts to, because by this point the interpretation is done. That's the whole idea of climbing the ladder before the data reaches your logic.
To call it from a workflow you'd run the actor on a schedule and read the dataset; the standard ApifyClient pattern or an Apify webhook on run completion pushes the events straight into Slack, a ticket, or the next step in your scenario.
What are the alternatives to a signals and events layer?
The alternatives split into four named approaches, each fair for a different situation. The honest summary up front: each one either gives you data and leaves the interpretation to you, or owns the interpretation but at a cost or in a shape that may not fit an automation.
1. Raw market-data APIs (CoinGecko, CoinMarketCap, exchange APIs). These serve the data rung cleanly and cheaply. Best for: you only need numbers and a human or a downstream system does all the interpreting. Where it breaks at scale: you still own the entire signals and events layer, including thresholds, benchmark comparisons, regime classification, and cross-run state. That's a maintained service, not a config step.
2. DIY: API plus spreadsheet plus Zapier filters. Pull data, then manufacture signals and events with formulas, lookup tables, and filter steps. Best for: a single coin, a loose threshold, and a tolerance for drift. Where it breaks: you inherit threshold calibration, benchmark math, regime logic, and crucially the state engine for events, which means storing and diffing every previous run. As your coin count and your accuracy bar climb, this becomes a part-time maintenance job nobody scoped.
3. Trading-bot platforms and TA libraries. These compute indicators and can fire on conditions. Best for: execution-focused traders running strategies. Where it diverges from this use case: they're built to predict and to trade, output is tuned for order placement rather than clean enums for a Make or Dify branch, and many bundle buy/sell advice you may not want in an analytics or monitoring workflow.
4. A classified signals and events actor (the CoinGecko Crypto Market Intelligence actor). Owns the middle and top rungs and hands your automation stable enums plus a fixed event vocabulary, with cross-run watchlist memory. Best for: recurring crypto automations and dashboards that need to branch on meaning and change. Where it's not the fit: you want raw numbers only, or you want trade execution.
| Approach | What you get | Who owns signals + events | Branch-ready output? | Cross-run memory |
|---|---|---|---|---|
| Raw data API | Prices, % change, caps | You | No | No |
| DIY sheet + Zapier | Data + hand-built logic | You (and you maintain it) | Partly | You build it |
| Trading bot / TA lib | Indicators + execution | The platform | Tuned for trades, not enums | Varies |
| Classified signals actor | Signals + events as enums | The actor | Yes | Yes, watchlist |
Each approach has trade-offs in cost, maintenance burden, output shape, and whether it predicts or classifies. The right choice depends on how many coins you track, whether you need change detection, and whether the consumer is a human, a dashboard, or an automation. Pricing and features based on publicly available information as of June 2026 and may change.
Best practices for crypto monitoring automations
- Branch on enums, never on raw floats. Build your Make or Zapier logic around stable labels and event types. A condition on
marketState == "downtrend"survives; a condition on a raw percentage threshold drifts. - Treat events as the trigger, signals as the context. Fire your automation on an event (
market-regime-change,entered-top-25), then read the signals to decide how loud the alert should be. - Run on a schedule, not on demand. Events only exist relative to a previous state, so a one-shot run can't produce them. A recurring schedule is what gives the change-detection layer something to compare against.
- Keep a named watchlist. Cross-run memory only accumulates if the run knows which coins it's been tracking. Name the set so trajectory and recurrence build up over time.
- Separate classification from action. Let the signals layer say what is; keep the buy/sell or notify decision in your own logic, where you control it.
- Model cost before you commit. Use the ApifyForge cost calculator to estimate per-run spend at your coin count and schedule frequency.
- Validate the output shape once, up front. Confirm the field names and enums your workflow depends on with the schema validator so a future change doesn't silently break a downstream filter.
- Don't rebuild the interpretation layer "just to understand it." Understanding the ladder is useful. Re-implementing the thresholds, benchmarks, and state engine is the treadmill this whole post is warning you about.
Common mistakes when monitoring crypto data
- Mistaking a row dump for monitoring. Pulling 100 coins into a sheet every hour isn't monitoring, it's collecting. Monitoring means you only look when something changed. Without an events layer, you're the change detector.
- Setting fixed thresholds and forgetting them. A "+5% is strong" rule flags nothing in a flat market and everything in a melt-up. Thresholds that don't adapt to regime are the most common silent failure in DIY setups.
- Trying to detect events from a single snapshot. Events are differences across time. If your pipeline has no memory of the last run, it physically cannot produce "what changed", only "what is".
- Treating classification as prediction. A
strong-uptrendlabel describes observed data. It is not a forecast and not advice. Wiring it straight into an order is a category error that this kind of deterministic output is explicitly not built for. - Comparing against the wrong benchmark. A coin up 3% while Bitcoin is up 8% is lagging, not strong. Without benchmark context (
outperforming-btc,outperforming-both), absolute moves mislead constantly. - Letting prose into the branch condition. If your automation has to parse a sentence to decide what to do, it'll break. Branch on enums; keep the human-readable summary for the human.
A before-and-after worth showing
Here's a compact, anonymised picture from the kind of monitoring workflow this pattern is built for.
Before: An analyst pulled the top 50 coins from CoinGecko into a sheet twice a day, ran a column of percentage-change formulas, eyeballed which ones looked strong against Bitcoin, and manually compared today's tab against yesterday's to spot anything new. Call it 30-40 minutes a day of pure triage, plus a recurring "my thresholds feel wrong again" tax every few weeks when the market changed character.
After: The same job runs on a schedule. Signals arrive pre-classified, and the events layer surfaces only the handful of changes that crossed a line: a regime flip, two coins entering the top 25, one relative-strength upgrade. The analyst reads three events instead of scanning 50 rows. The daily triage collapses from roughly half an hour to a couple of minutes, and the threshold-drift tax disappears because the classification isn't hand-tuned in a sheet anymore.
These numbers reflect one workflow and will vary with coin count, schedule frequency, and how noisy the market is. The shape of the change, less scanning and more reacting, is the consistent part.
Implementation checklist
- Decide what you're monitoring: a fixed watchlist, the top N by market cap, or both.
- Pick the consumer: a Make scenario, a Zapier zap, a Dify or n8n flow, a dashboard, or an AI agent.
- Run the CoinGecko Crypto Market Intelligence actor once and inspect the signals and events fields in the dataset.
- Confirm the exact enums your branch logic will switch on, and lock them in with the schema validator.
- Put the actor on a schedule so the events layer has previous state to diff against.
- Add an Apify webhook on run completion to push events into Slack, a ticket, or the next workflow step.
- Build your branches on event types and signal enums, never on raw price floats.
- Keep your own action logic (notify, log, escalate) separate from the classification.
Limitations
A few honest constraints, because the ladder isn't magic:
- It classifies observed data; it does not predict. There's no forecast, no price target, and no buy/sell recommendation. If you need predictive trading signals, this is the wrong layer.
- Events need history. The very first run can't emit change events because there's no prior state. The events layer becomes useful from the second scheduled run onward.
- It's only as fresh as the source. Signals are computed off CoinGecko market data, so the classification inherits the source's update cadence and any gaps in it.
- Thresholds are rules, not opinions. Deterministic classification means it won't read sentiment, news, or on-chain context. It's a market-data interpreter, not a research analyst.
- You still own the action. The output tells you what changed and what it means. What you do about it, notify, hold, escalate, stays in your workflow by design.
Key facts about the Data to Signals to Events ladder
- Data is a raw measurement; a signal is a classification of that measurement; an event is a change between two measurements over time.
- An automation can branch reliably on a signal or event, but not on a raw price float.
- Event detection is impossible from a single snapshot because events are defined as differences across runs.
- The signals and events layer, not the data, is where the maintenance cost and the value both concentrate.
- A signal like
strong-uptrendis a deterministic classification of observed data, not a price prediction or trading advice. - Benchmark context (whether a coin beats Bitcoin and the broad market) changes the meaning of an identical percentage move.
- Cross-run watchlist memory is what makes longitudinal context like leadership transitions detectable at all.
Glossary
- Data -- Raw crypto market measurements: prices, percentage changes, market caps, volume, dominance.
- Signal -- A classification of data into a labelled interpretation, such as a market state, relative-strength rank, or composite score.
- Event -- A detected change between runs, drawn from a fixed vocabulary like
market-regime-changeorentered-top-25. - Market regime -- A high-level classification of overall market conditions (for example risk-on, risk-off, or volatile).
- Relative strength -- How a coin is performing against a benchmark such as Bitcoin or the broad market, rather than in isolation.
- Composite score -- A single 0-100 number that rolls multiple signal inputs into one comparable figure.
Broader applicability
The Data to Signals to Events ladder isn't really about crypto. It's the same pattern that shows up anywhere raw data has to drive action. We've made this exact argument for Reddit monitoring, for Google Maps data, and for decision-first analytics generally. The universal principles:
- Raw measurements are commoditised; interpretation is the product. Whatever the source, the bottom rung is cheap and the top rungs are where the work is.
- Automations branch on stable labels, not raw values. A deterministic enum is the only thing a router or filter can switch on safely.
- Change requires memory. "What changed" is undetectable without state from the previous observation.
- Classification and action must stay separate. Let the system say what is; keep what-to-do under your control.
- Calibration drifts. Any threshold-based interpretation needs maintenance, which is exactly why owning it yourself is a recurring cost, not a one-off build.
When you need this
You probably need a signals and events layer if:
- You're building a recurring crypto automation in Make, Zapier, Dify, or n8n.
- You're feeding a dashboard or an AI agent that has to react to meaning or change, not raw numbers.
- You track more than a couple of coins and your manual triage is creeping up.
- You keep rewriting thresholds every time the market changes character.
You probably don't need it if:
- You only want raw numbers and a human reads them off a chart.
- You're running a trading bot that needs execution and order placement, not classification.
- You're doing a one-off analysis with no recurring monitoring.
- You want price predictions or buy/sell advice, which this deliberately doesn't provide.
Want signals instead of raw data?
If you've read this far, the real choice is between owning the interpretation layer or consuming it.
CoinGecko gives you: price, market cap, percentage changes, volume, dominance.
The CoinGecko Crypto Market Intelligence actor gives you: market states, relative strength, benchmark context, composite scores, market regime and health, a stable event vocabulary, opportunities, and persistent cross-run memory.
Same source data underneath. The difference is which rung of the ladder reaches your automation. If you'd rather branch on what changed than re-derive it every run, that's the bridge.
The crypto monitoring cluster
This is the pillar piece. Each rung of the ladder gets its own deeper dive:
- How to Detect Crypto Market Regime Changes -- the events rung: why detecting a change (not just reading the current regime) requires cross-run state.
- Relative Strength vs Price Performance -- the signals rung: why a coin up 3% while Bitcoin is up 8% is lagging, not strong.
- Stop Building Crypto Monitoring Spreadsheets -- what it actually costs to own the signals-and-events layer by hand.
Frequently asked questions
What is the difference between a signal and an event in crypto monitoring?
A signal is a classification of the current data, like labelling a coin strong-uptrend or ranking its relative strength. An event is a detected change between runs, like a coin entering the top 25 or the market regime flipping. Signals describe the present state; events describe what changed since last time. You typically branch your automation on the event and read the signal for context.
Does this give me buy or sell signals?
No. The classification is deterministic and descriptive: it labels observed market data, it doesn't predict price or recommend trades. A label like strong-uptrend describes what the data currently looks like, not what it will do next. Keeping classification separate from action is intentional, so your own workflow stays in control of any decision to notify, hold, or escalate.
Why can't I just use CoinGecko directly in my automation?
CoinGecko serves the data rung beautifully, but it returns raw numbers. Your automation can't reliably branch on a float like +6.2% because that value means different things in different market conditions. You'd have to build and maintain the signals and events layer yourself, including thresholds, benchmark comparisons, and cross-run state. CoinGecko gives you data; the interpretation layer is the part that's missing.
Why do I need to run it on a schedule?
Events are defined as changes between two points in time, so they only exist relative to a previous run. A single one-off run can produce signals (the current classification) but not events, because there's nothing to compare against. Running on a schedule gives the change-detection layer the prior state it needs, and it lets watchlist memory accumulate longitudinal context like leadership transitions.
How does the output work with Make, Zapier, or Dify?
Every meaningful field is a stable enum or score, so your scenario branches on it directly. A Make router can switch on marketState, a Zapier filter on an events[].type like entered-top-25, and a Dify flow can read the composite score. Because the output is deterministic, the same data yields the same enums every run, which is exactly what automations and agents need to behave predictably.
Is this the same as a trading bot?
No. A trading bot is built to predict and execute orders, and its output is tuned for placement. This is a classification and monitoring layer: it turns market data into labelled signals and change events for analytics, dashboards, and workflow automation. It does no trading, gives no advice, and writes nothing to an exchange. It's one of the better fits when you want to react to what changed rather than place trades.
Ryan Clinton publishes Apify actors and MCP servers as ryanclinton and builds developer tools at ApifyForge.
Last updated: June 2026
This guide focuses on CoinGecko market data and the Apify platform, but the same Data to Signals to Events pattern applies broadly to any domain where raw measurements have to drive automated action.