The problem: You wired CoinGecko into a Google Sheet. Day one it was one tab and a column of prices, and it felt great. Six months later it's twenty tabs deep, half your thresholds were tuned to a market that no longer exists, alerts fire at 3am over nothing, and nobody on the team trusts the numbers anymore so they've quietly gone back to eyeballing raw prices, which is exactly where they started. The sheet isn't broken because you're lazy or bad at spreadsheets. It's broken because a spreadsheet has no memory of why a threshold was set, no concept of market regime, and no clean way to tell you what changed versus what merely is. Every fix you add makes it worse.
Why should you stop building crypto monitoring spreadsheets? Because a spreadsheet can hold data but can't hold the interpretation layer that makes data actionable. It has no cross-run memory, no built-in notion of market regime, and every threshold you hand-tune drifts as the market moves, so the maintenance cost grows faster than the value. You end up maintaining a tool instead of using one.
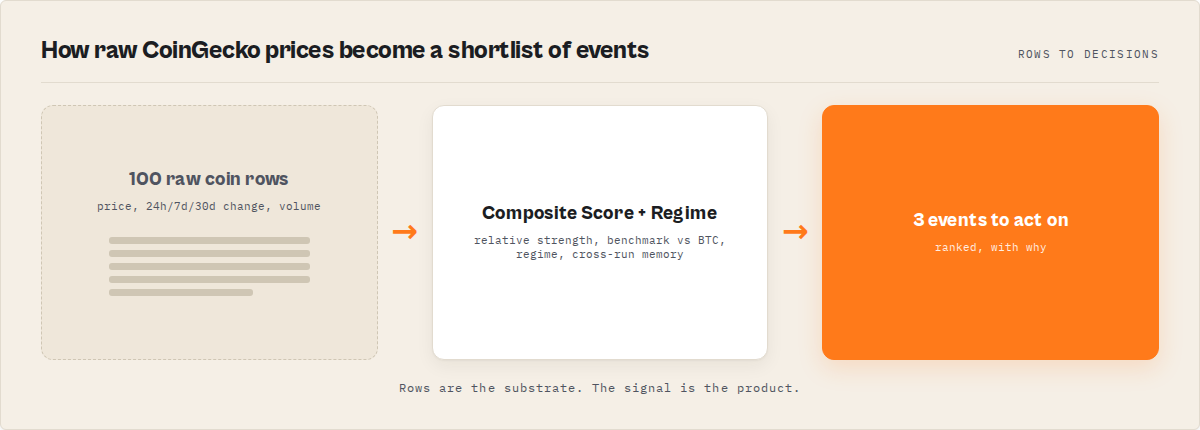
What to use instead: a scheduled run that already owns the interpretation layer and hands your automation classified signals and a stable event vocabulary directly, with cross-run memory so it can tell you what changed. The CoinGecko Crypto Market Intelligence actor is built for exactly this, but the argument below applies to any tool that owns the layer your sheet is trying to be.
A spreadsheet stores numbers. It can't store the reason a threshold exists, the memory of last week, or the concept of a regime. That's the layer eating your weekends.
Also known as: crypto tracking spreadsheet, DIY crypto dashboard, Google Sheets crypto monitor, homegrown market tracker, the crypto monitoring treadmill, the spreadsheet maintenance trap.
Quick answer
- What this is about: the lifecycle of a DIY crypto monitoring spreadsheet, why it always rots, and what replaces it.
- When the spreadsheet is fine: a one-off glance, a hobby portfolio, a single price you check by hand. No automation, no team, no alerts.
- When it stops being fine: the moment you want to be told something changed instead of looking, or anyone other than you depends on the numbers.
- The core failure: a sheet has no memory, no regime concept, and no audit trail for its own thresholds, so it can never reliably tell you what changed.
- The main tradeoff: building it yourself looks free and stays cheap for about a month, then the maintenance tax compounds. Handing the interpretation layer to a tool costs a little per run and stops the bleeding.
In this article: Why it fails · The lifecycle · What's missing · Alternatives · Mistakes · Limitations · FAQ
Key takeaways
- The sheet rots on a predictable schedule. It feels like progress for roughly a month and becomes a maintenance job by month six. The pattern is consistent because the cause is structural, not personal.
- Threshold drift is the silent killer. A "+5% is strong" rule set in a calm market screams nonstop in a volatile one. The number didn't change; the market it was calibrated against did.
- A spreadsheet has no memory of last run. It can show you today's state. It physically cannot tell you what changed since yesterday without a second copy and a manual diff, which nobody keeps up.
- Surface area is the tax. Every column, tab, and alert rule you add to patch a gap becomes another thing that breaks, and the breakage compounds faster than the feature pays off.
- The fix is to stop owning the interpretation layer. Signals and events (what it means, what changed) are the hard, valuable part. Hand them to a tool that already produces them deterministically and the treadmill stops.
What a spreadsheet promises vs what it delivers
| What you wanted | What the sheet does on day one | What the sheet does by month six |
|---|---|---|
| "Tell me which coins are strong" | One relative-strength column, looks great | Three conflicting strength columns, nobody remembers which is current |
| "Strong compared to what?" | A benchmark column pinned to BTC | A benchmark that drifted; "outperforming" now means nothing consistent |
| "Rank them for me" | A tidy leaderboard tab | A ranking tab fed by stale lookups that silently 404 on renamed coins |
| "Just alert me" | One threshold, one notification | Alerts firing at 3am over noise; everyone muted the channel |
| "Did the market turn?" | (no column for this) | Still no answer, because a sheet can't diff against last week |
Illustrative pattern based on common DIY crypto-monitoring setups, not a specific user. The failure modes are structural.
Why do crypto monitoring spreadsheets always fail?
Crypto monitoring spreadsheets fail because they store data but can't store interpretation. A sheet has no memory of the previous run, no built-in concept of market regime, and no record of why any threshold was set, so hand-tuned rules drift as the market moves and the maintenance cost climbs faster than the value the sheet returns.
That's the short version. The longer one is worth sitting with, because the reason isn't the reason most people assume.
It isn't a skill problem. Plenty of sharp people build these sheets, and the formulas are usually fine. It isn't a discipline problem either, though it gets blamed on one ("we just need to keep it updated"). The trap is structural. A spreadsheet is a snapshot machine. It is very good at showing you what is true in one cell at one moment, and it is fundamentally unable to do the three things crypto monitoring actually needs: remember, contextualise, and detect change.
So you spend month one building the snapshot and feeling productive. Then reality arrives in three waves.
What does a crypto spreadsheet look like six months in?
Six months in, a crypto monitoring spreadsheet is typically twenty-plus tabs, several stale lookup columns that silently break when a coin gets renamed, a set of alert thresholds nobody can justify anymore, and a team that no longer trusts the output. The progression is so common it's almost a genre.
Here's the arc, and I've watched versions of it more times than I'd like.
Day one is clean. Prices in, one tab, done. Within a week you want to know if a coin is actually strong, not just up, so the sheet grows a relative-strength idea. Then "strong compared to what?" forces a benchmark. Then you want a leaderboard, so there's a ranking view. Then you're tired of looking, so there's an alert. Each step takes twenty minutes and feels like progress. Each step also adds surface area.
And surface area is not abstract. One alert is one threshold. Ten alerts are ten thresholds, which is ten future recalibrations the next time the market changes character. Every column you add is a thing you now have to keep true forever. The twenty-minute additions compound into a standing maintenance bill, and you signed up for it one reasonable-looking step at a time.
By month three the market has moved and your thresholds haven't. The "+5% is a strong day" rule you set during a flat stretch now fires constantly because volatility doubled. You retune it. A few weeks later it's wrong again, in the other direction. Nobody wrote down why it was 5% in the first place, so every retune is a guess layered on a guess.
By month six the alerts are noise, the team eyeballs raw prices because they don't trust the derived columns, and you're spending a chunk of every week keeping a tool alive instead of getting answers out of it. That's the treadmill. The whole point of the Data vs Signals vs Events ladder is that the signals-and-events layer is the hard part, and a sheet is the worst possible place to maintain it by hand.
What can a spreadsheet never do?
A spreadsheet can never reliably tell you what changed, because change is a comparison between two points in time and a sheet only holds one. It also has no native concept of market regime and no audit trail for its own thresholds. These aren't features you forgot to add; they're things the format can't hold.
Let me split the three structural gaps, because they're the whole argument.
No memory of last run. A sheet shows the present. To know that a coin entered the top 25, or that the market flipped from risk-off to risk-on, you need last run to compare against. People try to fake this with a "yesterday" tab they copy-paste by hand, and that lasts about a week before someone forgets. Detecting change needs durable cross-run state, which is exactly how regime-change detection works: you diff now against the stored previous state. No state, no change detection, ever.
No concept of regime. A single coin being up tells you nothing about whether the whole market just changed character. Regime (risk-on, risk-off, broad rally, broad sell-off, large-cap-led, neutral) is a property of the market as a whole, derived from breadth and leadership across many coins at once. A column can hold a number. It can't hold "the market's character flipped," because that's a classification over the whole set, recomputed and compared every run.
No memory of why. This one's subtle and it's the one that quietly kills trust. A threshold in a cell is just a number. The reasoning behind it (the volatility regime it was calibrated to, the benchmark it assumed, the date it was last sane) lives in someone's head, and heads leave. Six months on, no one can defend any number in the sheet, so no one trusts the output, so they go back to raw prices. Full circle.
What does the spreadsheet actually cost you?
The honest cost of a crypto monitoring spreadsheet isn't the hours you spend maintaining it. It's the decisions you make after trust collapses.
Once nobody trusts a derived signal, the alerts get muted, the rankings get ignored, the benchmark column gets quietly second-guessed, and everyone drifts back to staring at raw prices and going with their gut. The spreadsheet still exists. It still updates. Nobody acts on it. You're now paying the maintenance bill for a tool that no longer influences a single decision, and making those decisions the old way, by eye, under time pressure, which is exactly the failure mode the sheet was built to prevent.
That's the real bill: not the weekend you lost to a broken lookup, but the run of worse calls made in the months after the numbers stopped being believed. A maintenance cost you can measure. A trust cost you usually only notice in hindsight.
What does the output actually need to look like?
The output an automation can act on isn't a grid of numbers; it's classified signals plus a list of changes. Below is the shape: pre-labelled signals your workflow reads for context, and a short event list it branches on directly. This is what the sheet is failing to produce by hand. Notice what is missing from it: thresholds. There's no "+5%" to recalibrate, because the interpretation already happened.
{
  "marketRegime": "risk-on",
  "marketBreadth": "broad",
  "marketHealth": "healthy",
  "watchlist": [
    {
      "symbol": "ETH",
      "marketState": "strong-uptrend",
      "relativeStrengthRank": 3,
      "benchmarkContext": "outperforming-both",
      "compositeScore": 78
    }
  ],
  "events": [
    { "type": "market-regime-change", "detail": "neutral -> risk-on" },
    { "type": "entered-top-25", "symbol": "SOL" },
    { "type": "leadership-transition", "detail": "large-cap -> alt-led" }
  ]
}
Notice what your automation does with this. It doesn't parse a float and re-derive meaning. It switches on events[].type (a fixed enum like market-regime-change or entered-top-25) and reads the signals for context to decide how loud to be. That events array is the thing a spreadsheet can never produce, because producing it requires remembering last run. To see how an automation routes on enums like these, the decision-first analytics pattern covers the general shape: one routable verdict per record instead of a wall of state.
That's the whole difference in one line: the spreadsheet stores conditions; the automation consumes decisions. A condition is a threshold you maintain forever. A decision is a result you act on and move past.
What are the alternatives to a crypto monitoring spreadsheet?
There are four broad alternatives to a DIY crypto monitoring spreadsheet, and they sit on a spectrum from "you maintain everything" to "you maintain nothing." Each trades effort, cost, and trust differently. Here's the honest map.
1. Keep building the spreadsheet. Best for: a single person, a hobby portfolio, a one-off check. It's genuinely fine until you want to be told about change or anyone else depends on it. Past that point you own threshold drift, the missing memory layer, the missing regime concept, and an ever-growing pile of tabs. That's not a tool, it's a part-time job you didn't apply for.
2. A raw crypto data API plus your own code. Best for: teams with engineering time who want full control. CoinGecko and similar APIs ship the bottom layer (price, percentage change, market cap) cheaply. But the data was never the hard part. Build on raw data and you still own signal classification, benchmarking, the 0-100 scoring, regime detection, cross-run state, and the event vocabulary, plus the testing and on-call for all of it. That's a maintained service, not a script.
3. A consumer crypto dashboard or alert app. Best for: humans who want to look at charts. These are polished and stateless: they tell you what's true now and ping you on a price threshold. What they generally don't give you is a machine-readable event your Make, Zapier, n8n, or Dify workflow can branch on, or durable watchlist memory you control. Great for eyeballing, weak for automation.
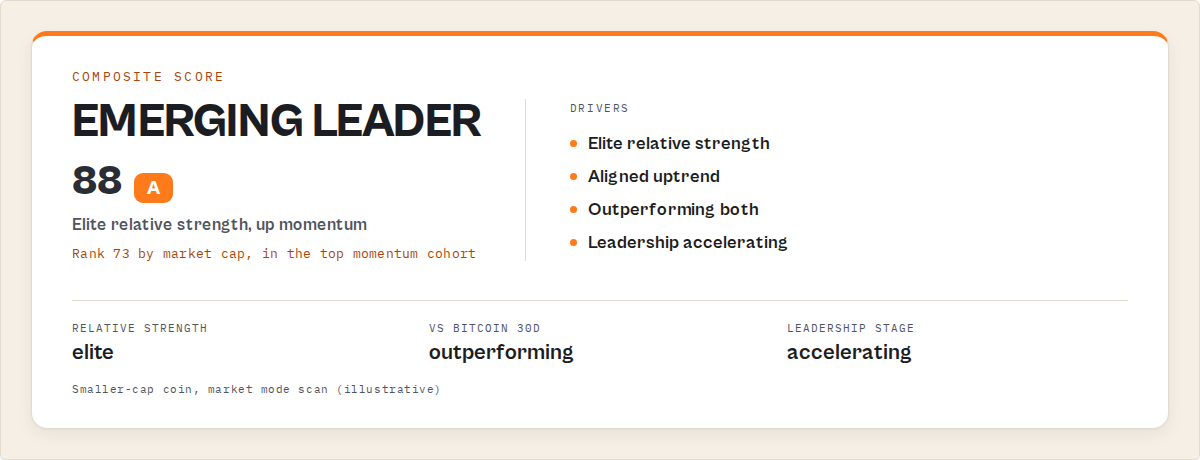
4. A scheduled intelligence actor that owns the interpretation layer. Best for: anyone automating off crypto data who wants signals and events handed over directly. This is where the CoinGecko Crypto Market Intelligence Apify actor sits. It classifies each run into signals (market state, relative strength, composite score, benchmark-vs-BTC context, regime, breadth, health), emits a stable event vocabulary (market-regime-change, entered-top-25, leadership-transition, and more) as enums an automation switches on, and keeps cross-run watchlist memory so it can tell you what changed. Deterministic, no AI, no buy/sell advice.
| Approach | Who maintains the interpretation layer | Has cross-run memory | Branchable events for automation | Maintenance trend over time |
|---|---|---|---|---|
| DIY spreadsheet | You, forever, by hand | No (manual copy-paste at best) | No | Climbs steeply |
| Raw API + own code | You and your engineers | Only if you build it | Only if you build it | Climbs with scale |
| Consumer dashboard/app | The vendor (for humans) | Usually not exposed | Not a core feature | Flat but not automatable |
| Scheduled intelligence actor | The tool | Yes, built in | Yes, as enums | Roughly flat |
Pricing and features based on publicly available information as of June 2026 and may change. Each approach trades effort, cost, and control differently; the right choice depends on whether you're automating, who depends on the output, and how much engineering time you want to spend maintaining a layer rather than using one.
If you want to sanity-check the running cost of a scheduled actor against the hours your sheet eats, the cost calculator estimates per-run cost so you can compare it against your own time.
Best practices if you monitor crypto at all
Whether you stay on a sheet or move off it, a few principles keep crypto monitoring sane. These apply regardless of tool.
- Decide upfront whether you're automating or eyeballing. A human looking at a chart and a workflow branching on a label have completely different needs. A sheet can sort of serve the first. It cannot serve the second.
- Separate "what is" from "what changed." State and change are different jobs. Reading the current regime is easy; detecting the flip needs memory. Don't build a tool that conflates them and calls a thermometer a forecast.
- Never hand-tune a threshold without recording why. If you can't write down the reasoning beside the number, the number is already untrustworthy. This is the line a sheet can't hold.
- Branch automations on stable labels, not raw floats. A
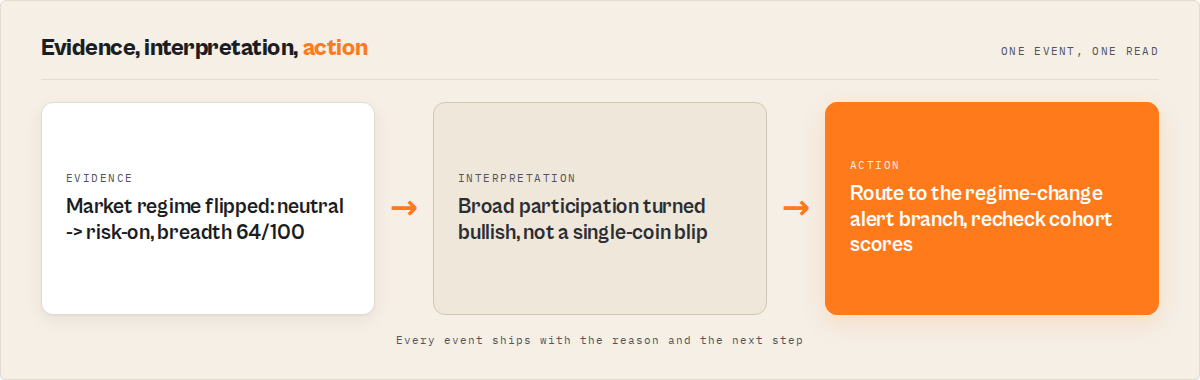
+6.2%means something different every hour. An enum likeentered-top-25means the same thing every run. Switch on the enum. - Treat the event as the trigger and the signal as the volume knob. Fire on the change, then read the signals to decide how loud the alert should be. This kills 3am noise.
- Stop owning layers a tool already owns. If something already produces deterministic signals and events with memory, owning that yourself by hand is choosing a maintenance job over an answer.
- Keep the cohort in one place. Watchlist drift across tabs is how "outperforming BTC" ends up meaning three different things. One canonical set, recomputed each run, is the only version that stays honest.
Common mistakes
- Treating the data as the hard part. Fetching prices is the easy 10%. The interpretation layer (signals and events) is the 90% that eats your time. Optimising the easy part and hand-building the hard part is backwards.
- Faking memory with a "yesterday" tab. Manual copy-paste of last run lasts about a week before someone forgets, and then your change detection is silently wrong without anyone noticing. Memory has to be durable and automatic or it isn't memory.
- Confusing a signal with a prediction. A label like
strong-uptrenddescribes observed data deterministically. It is not a forecast and not buy/sell advice. Treating classification as a crystal ball is the single biggest category error here. - Letting thresholds outlive their market. A rule calibrated to a calm market is wrong in a volatile one, and vice versa. A static number in a cell can't recalibrate itself, so it rots silently.
- Adding a column for every gap. Each patch adds surface area, and surface area is the thing breaking on you. The instinct to fix the sheet is the trap; more sheet is more maintenance.
- Building for one user, deploying for a team. A sheet one person understands becomes untrustworthy the moment a second person depends on it and can't see why any number is what it is.
Mini case study: the analyst who stopped maintaining the sheet
Before: An ops analyst on a small crypto desk kept a tracking sheet. CoinGecko feed, a relative-strength column, a BTC benchmark, a ranking tab, and a stack of alert rules. By the half-year mark it was around twenty tabs, the alerts fired so often the team muted them, and the analyst spent roughly half an hour every morning re-checking derived columns against raw prices because nobody trusted them. The threshold-retuning happened ad hoc, undocumented, whenever something looked off.
After: The interpretation layer moved to a scheduled run. Signals arrive pre-classified each morning, and the events layer surfaces only the handful of changes that crossed a line: a regime flip, two coins entering the top 25, one leadership transition. The analyst reads three events instead of scanning fifty rows. The morning triage drops from about thirty minutes to a couple of minutes, and the threshold-drift tax disappears because the classification isn't being hand-tuned in a sheet anymore.
These numbers reflect one workflow on one desk. Results vary with cohort size, run cadence, and how noisy your previous alert rules were. The point isn't the exact minutes saved; it's that the maintenance line went from climbing to flat.
Implementation checklist: moving off the spreadsheet
- List what the sheet currently derives. Strength, benchmark, ranking, alerts. That list is your interpretation layer, and it's what you're trying to stop maintaining.
- Separate state from change. Mark which outputs are "what is" (signals) and which are "what changed" (events). The events are the ones your sheet was never really doing.
- Pick the cohort once. Decide the watchlist of coins you care about, in one place.
- Point a scheduled run at that cohort. Configure the actor to classify those coins each run and keep watchlist memory between runs.
- Route events into your existing automation. Branch your Make, Zapier, n8n, or Dify flow on the event enum, and read signals for context.
- Delete the derived columns. Once the events flow, the relative-strength column, benchmark column, and ranking tab are dead weight. Removing them is the moment the treadmill stops.
- Keep the raw price tab if you like. Eyeballing a chart is still a fine human thing to do. Just stop maintaining the interpretation layer by hand.
Limitations
A few honest constraints, because this isn't magic.
- This is classification, not prediction. Signals and events describe observed market data deterministically. Nothing here forecasts price or tells you to buy or sell. If you want trading advice, this is the wrong tool category entirely.
- You still need an Apify account and a schedule. A scheduled actor isn't zero-setup. You configure the run, set the cadence, and wire the output into your automation once. It's setup you do once, not maintenance you do forever, but it isn't nothing.
- Cross-run memory depends on consistent runs. Event detection diffs against the last run's stored state. If you run sporadically, "what changed" spans a longer, lumpier window. Memory works best on a steady cadence.
- Coverage is the cohort you choose. The tool classifies the coins and market you point it at. It doesn't watch everything; it watches your watchlist, well.
- A spreadsheet is genuinely fine for a glance. If you're one person checking a price by hand once a day, none of this applies. The treadmill only starts when you automate or when others depend on the numbers.
Key facts about crypto monitoring spreadsheets
- A DIY crypto monitoring spreadsheet typically feels productive for about a month and becomes a maintenance job by month six.
- The core failure is structural: a spreadsheet holds one snapshot and cannot diff against a previous run, so it can't detect change.
- Threshold drift means a "strong day" rule calibrated to a calm market fires constantly in a volatile one, with no self-recalibration.
- Market regime is a classification over the whole market (risk-on, risk-off, broad rally, broad sell-off, large-cap-led, neutral), not a value a single column can hold.
- Events like
market-regime-change,entered-top-25, andleadership-transitionrequire durable cross-run state to detect. - A spreadsheet's thresholds have no audit trail, so trust in derived numbers decays as the people who set them move on.
- The CoinGecko Crypto Market Intelligence actor produces signals and events deterministically with cross-run memory, and gives no buy/sell advice.
Short glossary
- Interpretation layer -- The signals and events derived on top of raw data; the part that makes data actionable and the part a spreadsheet maintains worst.
- Threshold drift -- When a hand-set rule (like "+5% is strong") becomes wrong because the market it was calibrated against changed.
- Market regime -- The overall character of the market at a point in time, classified from breadth and leadership across many coins.
- Event -- A detected change between runs, drawn from a fixed vocabulary like
market-regime-changeorentered-top-25. - Cross-run memory -- Durable state from previous runs that lets a tool diff now against then and surface what changed.
- Surface area -- The total count of columns, tabs, and rules in a tool; the thing that breaks, and the tax that grows as you patch.
Where these patterns apply beyond crypto
The spreadsheet trap isn't really about crypto. It's about what happens whenever a sheet is asked to be an interpretation layer it can't hold. The same pattern shows up across domains.
- Any monitoring where "what changed" matters more than "what is." Reviews, hiring signals, supply-chain risk, social mentions. State is easy; change needs memory.
- Any hand-tuned threshold in a moving environment. If the world the rule was calibrated to shifts, a static number rots. This is universal.
- Any tool one person understands and a team depends on. Undocumented reasoning kills trust the moment ownership transfers.
- Any case where patching adds surface area faster than it adds value. The instinct to fix the sheet is often the trap itself.
- Any automation that should branch on meaning, not raw measurements. Workflows want stable labels, not floats that mean something different every hour.
When you should move off the spreadsheet
Move off the DIY crypto monitoring spreadsheet if:
- You want to be told something changed instead of looking for it.
- Anyone other than you depends on the numbers.
- You're spending real time each week keeping the sheet alive rather than using it.
- You're feeding a Make, Zapier, n8n, or Dify automation that needs something stable to branch on.
- You've already retuned the same threshold more than twice and stopped being able to justify the value.
You probably don't need to move off it if:
- You're one person glancing at a portfolio by hand.
- There's no automation and no alerting involved.
- The sheet has stayed at one or two tabs and isn't growing.
- You genuinely enjoy maintaining it as a hobby (no judgement).
What you're actually replacing
Here's the reframe that makes the decision easy: you're not replacing Google Sheets. Sheets is fine. It was never the problem.
You're replacing the job the sheet quietly turned into: threshold maintenance, alert tuning, ranking formulas, benchmark drift, hand-copied day-over-day diffs, and DIY state tracking. That is the work you're firing, not the tool. The CoinGecko Crypto Market Intelligence actor owns that layer on a schedule and hands your automation classified signals and a stable event vocabulary directly, so the only thing left in your court is deciding what to do when something actually changes.
The crypto monitoring cluster
Part of a four-piece set on turning crypto data into something you can act on:
- Data vs Signals vs Events in Crypto Monitoring -- the pillar: the framework behind this whole argument.
- How to Detect Crypto Market Regime Changes -- the events rung: why detecting a change needs cross-run state.
- Relative Strength vs Price Performance -- the signals rung: why a coin up 3% while Bitcoin is up 8% is lagging.
Frequently asked questions
Why do crypto monitoring spreadsheets get so unmanageable?
Because every gap you patch adds surface area, and surface area is what breaks. A spreadsheet can't hold memory of last run, the concept of market regime, or the reasoning behind a threshold, so you compensate with more columns, tabs, and rules. Each addition feels like progress and quietly becomes another thing to maintain, until the maintenance outweighs the value.
What should I use instead of a crypto tracking spreadsheet?
Use a tool that owns the interpretation layer, meaning it produces classified signals and a stable event vocabulary with cross-run memory, on a schedule. The CoinGecko Crypto Market Intelligence actor is one of the better fits for automation because it hands your Make, Zapier, n8n, or Dify workflow events to branch on directly instead of raw numbers to re-derive meaning from.
Can't I just add a "yesterday" tab to detect changes?
You can try, and it works for about a week. Manual copy-paste of last run isn't durable memory; the moment someone forgets to copy, your change detection is silently wrong and nobody notices. Reliable change detection needs automatic, durable cross-run state. A spreadsheet doesn't have one natively, which is why faking it always rots.
Is the actor giving me trading advice?
No. It's deterministic classification, not prediction. It labels observed market data into signals (like strong-uptrend or a relative-strength rank) and detects changes between runs (like entered-top-25). It does not forecast price and does not tell you to buy or sell. If you want trading signals in the financial-advice sense, this is the wrong category of tool.
How is this different from a crypto dashboard app?
Consumer dashboards are built for humans to look at and are usually stateless: they show what's true now and alert on a price threshold. They generally don't expose a machine-readable event your automation can branch on, or give you durable watchlist memory you control. A scheduled intelligence actor is built for automation first, so the output is enums and signals, not just charts.
How much does running a scheduled actor cost compared to the spreadsheet?
The sheet looks free but costs you hours every week in maintenance and threshold retuning, plus the cost of decisions made on numbers nobody trusts. A scheduled actor costs a small amount per run. You can estimate that with the cost calculator and weigh it against your own time. For most people automating off crypto data, the hours saved dwarf the per-run cost.
Ryan Clinton publishes Apify actors and MCP servers as ryanclinton and builds developer tools at ApifyForge.
Last updated: June 2026
This guide focuses on crypto monitoring with CoinGecko data, but the same patterns apply broadly to any monitoring where what changed matters more than what is.