The problem: You wire CoinGecko into Make or a dashboard, a coin shows +3% today, the cell turns green, and you file it under "doing well." Except Bitcoin is up 8% and the whole market is up 6%. That coin isn't strong. It's lagging, and the green number lied to you. This is the single most common mistake in crypto monitoring: treating a raw percentage move as if it tells you whether something is leading or following. It doesn't. A number with no benchmark behind it is just a colour, and you act on colours at your own risk.
What is the difference between relative strength and price performance? Price performance is how much a coin moved in absolute terms (+3% today). Relative strength is how it moved against a benchmark, usually Bitcoin and the broad market. Price performance is a raw number with no context; relative strength tells you whether the coin is leading or following. A coin can be green on price and weak on relative strength at the same time.
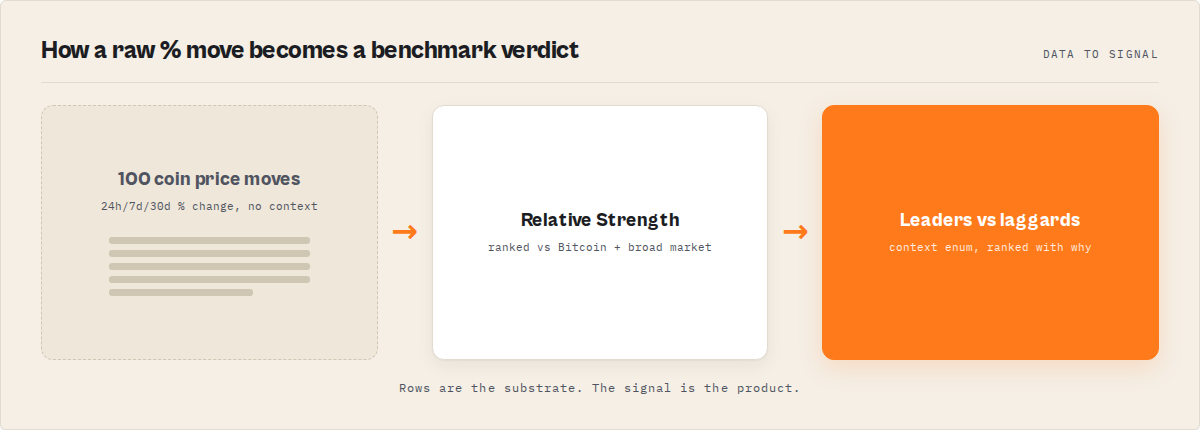
Why it matters: Absolute moves mislead constantly because they ignore context. A +3% day is a triumph in a flat market and an embarrassment when everything else is up 8%. Relative strength is the version that tells you the truth, because it grades the move against what the rest of the market did. In the data-to-signals-to-events terms from the pillar piece: a raw percentage is data, relative strength is a signal.
Use it when: You're building a crypto automation, dashboard, or AI agent in Make, Zapier, Dify, or n8n and you keep getting fooled by green numbers that are actually underperforming the market they live in.
Price performance is the raw move. Relative strength is the move against a benchmark. A green number can still be lagging.
Also known as: relative performance, benchmark-relative return, relative strength vs absolute return, RS vs raw price change, outperformance vs raw move, leadership vs lagging.
Quick answer
- What it is: two different measurements of the same coin. Price performance is the absolute percentage move; relative strength is that move ranked against a benchmark like Bitcoin and the broad market.
- When to use the distinction: any time you're deciding whether a coin is actually strong rather than just green, especially when automating off the answer.
- When it doesn't apply: a one-off manual glance where a human already has the market context in their head, or trade execution (this is classification, not buy/sell advice).
- The core trap: a raw percentage looks like a verdict but is only half the data. Without the benchmark, you can't tell leading from lagging.
- The main tradeoff: the benchmark comparison isn't a one-time formula. Benchmarks move, cohorts change, and "strong relative to what?" needs maintaining, which you either own or hand off.
In this article: What it is · Why raw % misleads · The 3% vs 8% case · Output example · Alternatives · Best practices · Common mistakes · Limitations · FAQ
Key takeaways
- The one-liner. Price performance is the raw move; relative strength is the move against a benchmark. A green number can still be lagging the market.
- Two measurements, not one. A coin's absolute return and its return relative to Bitcoin are different facts. Conflating them is why so many "strong" coins are actually laggards.
- Raw % is data; relative strength is a signal. A percentage move is a measurement with no opinion. Relative strength attaches the context (leading or following) that the percentage on its own can't.
- The benchmark is the whole point. "Strong" only means anything relative to something. Strip out Bitcoin and the broad market and you're left with a colour, not a verdict.
- Context shifts under you. Bitcoin's move, the broad-market move, and the cohort you rank against all change run to run. A relative-strength read is only as honest as the benchmark behind it, which is the part that needs maintaining.
- Classification is not prediction. A relative-strength rank describes observed performance deterministically. It doesn't forecast price or tell you to buy.
Same move, different verdict
The same +3% day, judged against three different backdrops:
| Coin's day | Bitcoin's day | Broad market | Price performance | Relative strength verdict |
|---|---|---|---|---|
| +3% | -2% | -1% | Green, looks fine | Strong, outperforming-both |
| +3% | +3% | +3% | Green, looks great | Neutral, just keeping pace |
| +3% | +8% | +6% | Green, looks fine | Weak, underperforming-both |
| -1% | -5% | -4% | Red, looks bad | Relatively strong, fell less |
| +12% | +2% | +1% | Green, looks amazing | Genuinely leading |
Read down the "price performance" column and four of those five look like wins. Read the last column and the story flips. That gap, between what the raw number says and what the benchmark says, is the entire subject of this post.
What is relative strength in crypto?
Definition (short version): Relative strength in crypto is a measure of how a coin performed against a benchmark, usually Bitcoin and the broad market, rather than in isolation. It answers "is this coin leading or following?" where price performance only answers "how much did it move?"
It's a way to put a number in context before you act on it. Price performance gives you a raw move with no opinion attached: +3%, -1%, +12%. Relative strength takes that move and grades it against what Bitcoin did and what the rest of the market did, then tells you whether the coin is ahead of the pack, with it, or behind it.
A relative-strength read is a signal, in the data-to-signals-to-events sense the pillar lays out. It sits above raw data (the percentage moves) and turns it into something you can judge. The percentage is the measurement. The relative-strength rank and the benchmark context are the interpretation.
That distinction is the whole article, because people collapse the two constantly. A coin is green, so it's "doing well," and the question of well compared to what? never gets asked. That unasked question is where most bad crypto reads come from.
Why does a raw percentage move mislead you?
A raw percentage move misleads you because it carries no context, and context is what turns a number into a verdict. +3% is a strong day in a falling market and a weak day in a ripping one, but the number is identical in both. On its own, a percentage can't tell you which world you're in.
Think about what the colour green is actually telling you. It says the coin went up. That's it. It says nothing about whether it went up more or less than it should have given what Bitcoin and the broad market did on the same day. A coin that rises 3% while everything around it rises 8% has, in any meaningful sense, lost ground. It's green and losing at the same time.
This is why "raw % change" sits on the data rung and not the signal rung. Data is a measurement. A signal is a measurement with a benchmark behind it. The jump from one to the other is the part that actually tells you something, and it's the part a green cell quietly skips.
The kicker: the benchmark isn't fixed. Bitcoin moves, the broad market moves, and the set of coins you'd rank against shifts as caps change. So "is this strong?" isn't a question you answer once. It's a question whose answer drifts every run, which is exactly why owning the comparison yourself turns into a moving target rather than a formula you write down.
Is a coin up 3% strong if Bitcoin is up 8%?
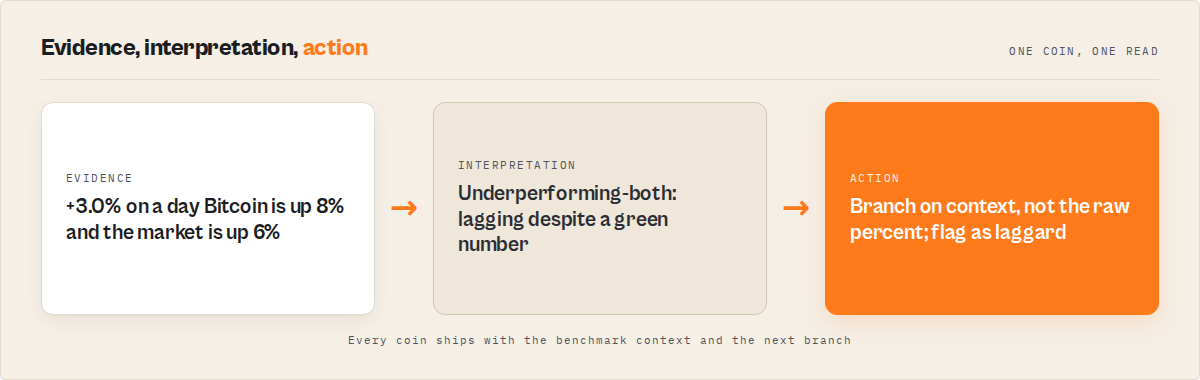
No. A coin up 3% while Bitcoin is up 8% is lagging, not strong, even though its raw number is green. In relative-strength terms it's underperforming the benchmark: the rest of the market moved further and faster, so on a relative basis the coin lost ground despite a positive day.
This is the cleanest example of the whole price-performance-versus-relative-strength split, so it's worth being blunt about it. Price performance says "+3%, good day." Relative strength says "you trailed Bitcoin by five points and trailed the broad market too, this is a laggard." Same coin, same day, opposite conclusions. The benchmark is what produced the difference.
And the inverse is just as true. A coin down 1% on a day Bitcoin is down 5% is, relatively, strong: it held up while the market fell. Price performance flags it red and tells you to worry. Relative strength flags it as one of the better names in a bad tape. If you're only watching the raw number, you react to exactly the wrong things, selling relative strength and buying relative weakness because the colours told you to.
What does "outperforming the market" actually mean?
"Outperforming the market" means a coin's move beat its benchmarks over the same window, not that it simply went up. The honest version separates two benchmarks: did it beat Bitcoin, and did it beat the broad market? A coin can outperform one and not the other, which is a different read again.
That's why a single green/red flag is too coarse. The useful version is a small set of contexts: outperforming both Bitcoin and the market, outperforming just one, or underperforming both. "Up 3%" tells you none of that. The benchmark context does.
How is relative strength different from a price alert?
A price alert fires on an absolute threshold ("BTC crossed $70k", "this coin is up 5%"), so it tells you a number was hit. A relative-strength read tells you where the coin sits against its peers and Bitcoin, which is a judgment the threshold can't make. One is a tripwire; the other is context.
The practical difference: a price alert pings you on moves that don't matter (everything's up, this coin's up too, so what) and stays silent on moves that do (this coin is quietly lagging a roaring market). Relative strength is built to catch the second case, which is the one a raw threshold structurally can't see.
What does a relative-strength output look like?
A relative-strength output is a structured object where the context is a stable label or rank your automation can branch on, not a raw percentage you have to interpret. The point is that the comparison is already done before the data reaches your logic. Here's the shape an automation would react to (illustrative values):
{
"coins": [
{
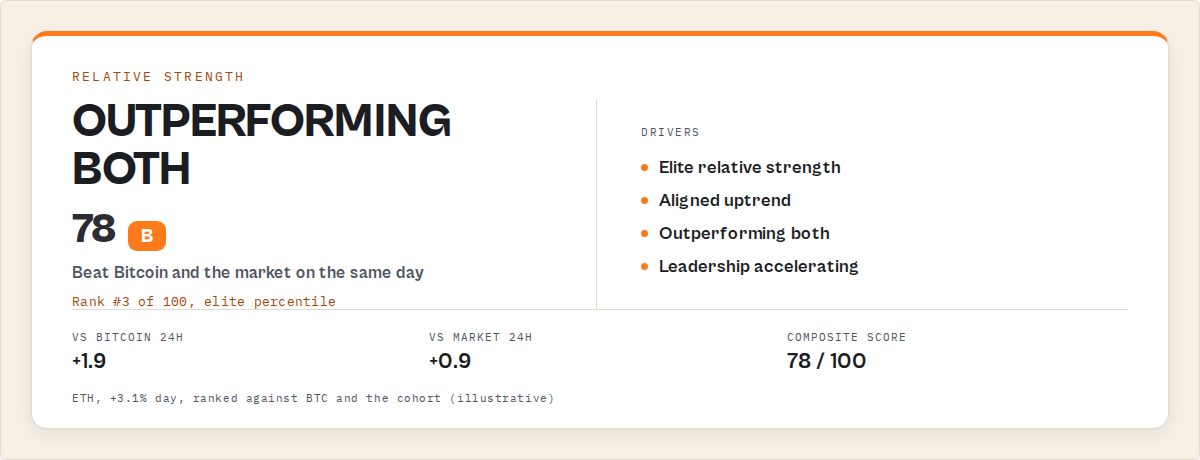
"symbol": "ETH",
"priceChange24h": 3.1,
"relativeStrength": { "rank": 3, "rating": "strong" },
"benchmarkComparison": {
"vsBtc": "outperforming",
"vsMarket": "outperforming",
"context": "outperforming-both"
},
"compositeScore": 78
},
{
"symbol": "DOGE",
"priceChange24h": 3.0,
"relativeStrength": { "rank": 41, "rating": "weak" },
"benchmarkComparison": {
"vsBtc": "underperforming",
"vsMarket": "underperforming",
"context": "underperforming-both"
},
"compositeScore": 22
}
]
}
Look closely at those two coins. Both moved roughly +3% on the day. On price performance they're twins. On relative strength they're opposites: ETH ranks near the top and is outperforming-both, DOGE ranks near the bottom and is underperforming-both. The raw priceChange24h is nearly identical and tells you nothing useful. The relativeStrength.rank, the benchmarkComparison.context enum, and the compositeScore are the fields that actually separate the leader from the laggard.
That's the whole idea: your workflow branches on context == "underperforming-both" or filters on relativeStrength.rating, not on a +3% float that means different things for different coins on different days.
To consume it from a workflow you'd run the actor on a schedule and read the dataset; the standard ApifyClient pattern or an Apify webhook on run completion pushes the per-coin context straight into Slack, a ticket, or the next step in your scenario.
What computes relative strength for you?
A tool computes relative strength for you by ranking each coin against the cohort and comparing its move to Bitcoin and the broad market on every run, so your automation receives a context label and a rank instead of a bare percentage. The comparison is done at the source, which is the part that's genuinely fiddly to keep honest.
Stated as a gap: most crypto feeds hand you the raw percentage and stop there. They give you price performance and leave relative strength, the part that actually tells you leading from lagging, for you to build and maintain.
The CoinGecko Crypto Market Intelligence Apify actor (ryanclinton/coingecko-crypto-data) is built to own that layer. Per coin it emits a relativeStrength rating and rank (where the coin sits within the cohort) and a benchmarkComparison block whose context enum is one of outperforming-both, outperforming-market, outperforming-btc, underperforming-both, underperforming-market, or underperforming-btc. It rolls those into a 0-100 compositeScore so you have one comparable figure across coins.
It's deterministic. No AI in the classification, no buy/sell advice, no prediction. It classifies observed performance against the benchmarks, it does not forecast where the coin goes next. CoinGecko gives you the raw percentage; this is the layer that tells you whether that percentage is leading or lagging.
What are the alternatives to a relative-strength layer?
The alternatives split into a few named approaches, each fair for a different situation. The honest summary up front: each one either hands you the raw percentage and leaves the benchmark comparison to you, or owns the comparison at a cost or in a shape that may not fit an automation.
1. Reading the raw percentage and judging by eye. A human sees +3%, mentally checks what Bitcoin did, and forms an impression. Best for: one experienced person watching a handful of coins with the market context already in their head. Where it breaks: it doesn't scale past a few coins, it's inconsistent run to run, there's no stable label to wire into a filter, and the moment you're tracking dozens of coins the mental benchmark math falls apart. You are the relative-strength engine, and you guess.
2. Raw market-data APIs (CoinGecko, CoinMarketCap, exchange APIs). These serve price performance cleanly and cheaply: the percentage moves, caps, and volumes. Best for: you only need the raw numbers and something downstream does the comparing. Where it breaks: there's no relative-strength rank and no benchmark context in the response. You own the entire comparison layer, including which benchmark, over which window, against which cohort, and keeping all three honest as they drift. That's a maintained service, not a config step.
3. DIY: API plus a spreadsheet or script that ranks coins yourself. Pull the percentages, then rank and compare them by hand. Best for: a fixed, tiny cohort and a tolerance for the result going stale. Where it breaks: you inherit benchmark selection, the comparison window, cohort stability (the set of coins you rank against changes as caps move), and recalibration every time the market changes character. As the coin count and accuracy bar climb, this quietly becomes a part-time maintenance job nobody scoped. We've watched this exact thing rot into a twenty-tab spreadsheet.
4. Trading-bot platforms and TA tooling. These compute indicators, some of which touch relative strength, and can fire on conditions. Best for: execution-focused traders running strategies. Where it diverges: they're built to predict and place orders, the output is tuned for trade execution rather than a clean context enum for a Make or Dify branch, and many bundle buy/sell advice you may not want in an analytics or monitoring workflow.
5. A classified relative-strength actor (the CoinGecko Crypto Market Intelligence actor). Ranks each coin against the cohort and emits the benchmark context and a composite score as stable fields. Best for: recurring crypto automations and dashboards that need to branch on leading-versus-lagging, not on raw percentages. Where it's not the fit: you want raw numbers only, or you want trade execution.
| Approach | What you get | Who owns the benchmark comparison | Branch-ready context? | Holds up across many coins |
|---|---|---|---|---|
| Eyeballing the % | A gut read | You (in your head) | No | No |
| Raw data API | Price performance only | You | No, numbers only | No, you scale it |
| DIY rank in a sheet | Data + hand-built ranking | You (and you maintain it) | Partly | Degrades fast |
| Trading bot / TA | Indicators + execution | The platform | Tuned for trades, not enums | Varies |
| Classified RS actor | Rank + context + score | The actor | Yes (context enum) | Yes |
Each approach has trade-offs in cost, maintenance burden, output shape, and whether it predicts or classifies. The right choice depends on how many coins you track, whether you need a stable label to automate on, and whether the consumer is a human, a dashboard, or an automation. Pricing and features based on publicly available information as of June 2026 and may change.
Best practices for using relative strength
- Judge moves against a benchmark, never in isolation. Before you call a coin strong, ask "compared to Bitcoin and the market?" If your workflow can't answer that, it's reacting to colours.
- Branch on the context enum, not the raw percentage. Build your Make or Zapier logic on
benchmarkComparison.contextorrelativeStrength.rating. A condition oncontext == "underperforming-both"survives; a condition on a raw percentage threshold drifts the moment the market changes character. - Use relative weakness as a flag, not just relative strength. A green coin lagging a strong market (
underperforming-bothwhile up) is often the more useful alert than yet another coin that's simply up. - Pair relative strength with the market regime. "Outperforming" in a broad rally and "outperforming" in a sell-off mean different things. Read the regime for the backdrop, the relative strength for the coin.
- Use the composite score for cross-coin comparison. A 0-100 score gives you one comparable figure, so you can rank a watchlist by relative strength rather than juggling percentages in your head.
- Model cost before you commit. Use the ApifyForge cost calculator to estimate per-run spend at your coin count and schedule frequency.
- Lock the output shape once, up front. Confirm the exact fields and enums your workflow depends on with the schema validator so a future change doesn't silently break a downstream filter.
- Don't rebuild the benchmark comparison "to understand it." Understanding why relative strength beats raw price is the point of this post. Re-implementing the benchmark selection, the window, and the cohort logic is the moving target this whole piece is warning you off.
Common mistakes with relative strength
- Reading green as strong. The most common error in crypto monitoring. A positive percentage means the coin went up, not that it's leading. Up 3% in an 8% market is a laggard wearing a green jersey.
- Reading red as weak. The inverse trap. A coin down 1% when the market is down 5% is relatively strong. React to the colour and you'll sell the resilient names in a downturn.
- Comparing against the wrong benchmark. "Strong" means nothing without "compared to what." A coin can beat Bitcoin and still trail the broad market, or vice versa. A single flag hides that; the benchmark context exposes it.
- Treating the benchmark as fixed. Bitcoin's move, the market's move, and the cohort all shift run to run. A relative-strength rule you set once and forget is comparing against a benchmark that no longer exists.
- Confusing classification with prediction. A
strongrelative-strength rating describes observed performance against the benchmark. It is not a forecast and not advice. Wiring it straight into an order is a category error this kind of deterministic output isn't built for. - Putting the raw percentage in the branch condition. If your automation switches on
priceChange24h > 3, it'll fire on laggards and miss resilient names. Branch on the relative-strength context; keep the raw number for the human.
A before-and-after worth showing
Here's a compact, anonymised picture from the kind of monitoring workflow this pattern is built for.
Before: An analyst pulled the top 50 coins from CoinGecko into a dashboard, sorted by 24-hour percentage change, and treated the top of that list as "the strong ones." On a broadly green day that meant chasing whatever had the biggest raw number, which was often a coin that had simply moved with the tide rather than ahead of it. The genuinely strong names, the ones outpacing Bitcoin, and the resilient names holding up in red, got lost because the sort key was the wrong measurement. Call it a daily ranking exercise that quietly optimised for the wrong thing.
After: The same job runs on a schedule, sorted by relative-strength rank and composite score instead of raw percentage. The list now surfaces coins that are outperforming-both regardless of whether the day is green or red, and flags green coins that are actually underperforming-both. The analyst stops chasing the biggest number and starts reading leading versus lagging directly. The "wait, why is this 'strong' coin underperforming the market?" confusion disappears, because the sort key finally matches the question.
These numbers reflect one workflow and will vary with coin count, schedule frequency, and how the market's moving. The shape of the change, from sorting on raw moves to sorting on context, is the consistent part.
Implementation checklist
- Decide what you're judging: a fixed watchlist, the top N by market cap, or both.
- Pick the consumer: a Make scenario, a Zapier zap, a Dify or n8n flow, a dashboard, or an AI agent.
- Run the CoinGecko Crypto Market Intelligence actor once and inspect the
relativeStrength,benchmarkComparison.context, andcompositeScorefields in the dataset. - Confirm the exact context enum and fields your branch logic will switch on, and lock them in with the schema validator.
- Put the actor on a schedule so you're reading current relative strength, not a stale snapshot.
- Add an Apify webhook on run completion to push the per-coin context into Slack, a ticket, or the next workflow step.
- Build your branches on the relative-strength context and rank, never on a raw price float.
- Keep your own action logic (notify, watch, escalate) separate from the classification.
Limitations
A few honest constraints, because relative strength isn't magic:
- It classifies observed performance; it does not predict. There's no forecast, no price target, and no buy/sell call. Relative strength tells you how a coin did against its benchmark, not what it'll do next.
- It's only as honest as the benchmark. The read depends on the benchmark, the window, and the cohort. Those are deliberate choices, and a different choice can produce a different verdict. The value is in keeping them consistent, not in any single "correct" benchmark.
- It's only as fresh as the source. Relative strength is computed off CoinGecko market data, so it inherits the source's update cadence and any gaps.
- It's a market-data read, not a fundamental one. Relative strength is deterministic classification of price moves against benchmarks. It doesn't read sentiment, news, tokenomics, or on-chain activity.
- You still own the action. The output tells you whether a coin is leading or lagging. What you do about it, notify, watch, ignore, stays in your workflow by design.
Key facts about relative strength vs price performance
- Price performance is a coin's absolute percentage move; relative strength is that move ranked against a benchmark like Bitcoin and the broad market.
- A coin up 3% while Bitcoin is up 8% is underperforming, not strong, because relative to the benchmark it lost ground.
- A coin can be green on price performance and weak on relative strength at the same time, which is why raw percentages mislead.
- Relative strength is a signal (an interpretation with a benchmark behind it); a raw percentage is data (a measurement with no context).
- Benchmark context can split three ways: outperforming both Bitcoin and the market, outperforming one, or underperforming both.
- A relative-strength rating is a deterministic classification of observed performance, not a price prediction or trading advice.
- The benchmark, the comparison window, and the ranked cohort all shift over time, so a relative-strength read needs a maintained benchmark rather than a fixed formula.
Glossary
- Price performance -- A coin's absolute move over a window, expressed as a raw percentage with no benchmark attached.
- Relative strength -- How a coin performed against a benchmark such as Bitcoin or the broad market, expressed as a rank or rating rather than a raw number.
- Benchmark -- The reference a move is judged against, typically Bitcoin and the broad crypto market.
- Benchmark context -- A label for how a coin compares to its benchmarks, such as
outperforming-bothorunderperforming-btc. - Composite score -- A single 0-100 figure that rolls relative-strength inputs into one comparable number across coins.
- Leading vs lagging -- Whether a coin is moving ahead of its benchmark (leading) or behind it (lagging), regardless of whether the raw move is positive.
Broader applicability
Relative strength versus price performance isn't really a crypto problem. It's the same shape that shows up anywhere a raw number gets mistaken for a verdict. The universal principle is that a measurement only becomes meaningful against a benchmark, and we've made versions of this argument for GitHub stars as a vanity metric, for decision-first analytics generally, and across the crypto monitoring cluster. The universal principles:
- A raw number is data; a benchmarked number is a signal. The benchmark is what turns a measurement into something you can judge.
- Context can flip the verdict. The same move is strong or weak depending entirely on what it's measured against.
- Benchmarks drift. Whatever you compare against changes over time, so a fixed comparison rule goes stale.
- Automations branch on stable labels. A context enum is something a router or filter can switch on safely; a raw float is not.
- Classification and action stay separate. Let the system say whether something is leading or lagging; keep what-to-do under your control.
When you need this
You probably need a relative-strength layer if:
- You keep getting fooled by green numbers that turn out to be lagging the market.
- You're building a recurring crypto automation in Make, Zapier, Dify, or n8n that should react to leading-versus-lagging, not raw moves.
- You're feeding a dashboard or an AI agent and you want it ranking coins by relative strength rather than by raw percentage.
- You track more than a handful of coins and the mental benchmark math has stopped scaling.
You probably don't need it if:
- You only want raw numbers and a human reads them with the market context already in their head.
- You're running a trading bot that needs execution and order placement, not classification.
- You're doing a one-off analysis with no recurring monitoring.
- You want price predictions or buy/sell advice, which this deliberately doesn't provide.
Want context instead of raw percentages?
If you've read this far, the real choice is between owning the benchmark comparison or consuming it.
CoinGecko gives you: price, market cap, percentage changes, volume. The raw move, and nothing about whether it's leading or lagging.
The CoinGecko Crypto Market Intelligence actor gives you: a relativeStrength rank and rating per coin, a benchmarkComparison.context enum against Bitcoin and the broad market, and a 0-100 composite score, all deterministic and ready to branch on.
Same source data underneath. The difference is whether a raw percentage reaches your automation or a verdict does. If you'd rather branch on leading versus lagging than re-derive it every run, that's the bridge. It pairs naturally with the regime detection and signals-and-events work in the rest of this cluster.
The crypto monitoring cluster
Part of a four-piece set on turning crypto data into something you can act on:
- Data vs Signals vs Events in Crypto Monitoring -- the pillar: the framework this post sits inside (raw % is data, relative strength is a signal).
- How to Detect Crypto Market Regime Changes -- the events rung: why detecting a change needs cross-run state.
- Stop Building Crypto Monitoring Spreadsheets -- why maintaining the benchmark comparison by hand is a treadmill.
Frequently asked questions
What is the difference between relative strength and price performance?
Price performance is a coin's absolute move, the raw percentage like +3%. Relative strength is that move judged against a benchmark, usually Bitcoin and the broad market, and expressed as a rank or rating. Price performance tells you how much something moved; relative strength tells you whether it's leading or following. A coin can be positive on price performance and weak on relative strength at the same time.
Is a coin up 3% strong if Bitcoin is up 8%?
No. A coin up 3% while Bitcoin is up 8% is lagging, not strong. On a relative basis it lost ground, because the benchmark moved further. Its raw number is green, which makes it look fine, but relative strength grades it against Bitcoin and the broad market and flags it as underperforming. This is the classic case of a green number that's actually weak.
Can a coin be down on the day and still be relatively strong?
Yes. A coin down 1% on a day Bitcoin is down 5% is relatively strong, because it held up while the market fell. Price performance flags it red and tells you to worry; relative strength shows it as one of the more resilient names. If you only watch the raw percentage, you'll misread resilience as weakness and react to the wrong thing.
Why is relative strength a signal and not data?
Because a signal is a measurement with a benchmark behind it, and data is the bare measurement. A raw percentage move is data: it has no opinion about whether the move was good relative to anything. Relative strength attaches the context, the comparison to Bitcoin and the market, that turns the number into a judgment your automation can act on. The benchmark is what makes it a signal.
Does this give me buy or sell signals?
No. The relative-strength classification is deterministic and descriptive: it labels how a coin performed against its benchmark, it doesn't predict price or recommend trades. A strong rating or an outperforming-both context describes what the data currently looks like, not what it'll do next. What you do about it, notify, watch, ignore, stays in your own workflow by design.
How does the relative-strength output work with Make, Zapier, or Dify?
Every meaningful field is a stable enum or score, so your scenario branches on it directly. A Make router can switch on benchmarkComparison.context, a Zapier filter on relativeStrength.rating, and a Dify flow can rank coins by compositeScore. Because the output is deterministic, the same data yields the same context every run, which is exactly what automations and agents need to behave predictably.
Ryan Clinton publishes Apify actors and MCP servers as ryanclinton and builds developer tools at ApifyForge.
Last updated: June 2026
This guide focuses on CoinGecko market data and the Apify platform, but the same distinction, that a raw measurement only becomes a verdict once it's judged against a benchmark, applies broadly to any domain where numbers have to drive automated action.