The problem: You manage three short-term rentals. Every week you open AirDNA, eyeball a couple of charts, export a comp table to a spreadsheet, and try to remember whether that pricing gap was there last month or if it's new. Then you do it again next week. Then you forget. The dashboard shows you data. It does not tell you what changed, what matters, or what to look at first. So you, the operator, become the monitoring engine. For free. Every single day. That's analytics. The shift is to operational awareness.
What is Airbnb operational awareness? Airbnb operational awareness is a stateful monitoring approach that watches a short-term rental market over time and surfaces what changed, what matters, and what to review first, instead of handing you charts to interpret by hand. It ranks attention, accumulates market memory across runs, and suppresses noise.
Why it matters: The 2026 bottleneck in short-term rental management isn't getting Airbnb data, it's noticing the change that matters before your comp set does. AirDNA charges per market per seat to show you charts; the interpretation, ranking, and run-over-run memory still happen in your head. A dashboard solves a problem most operators no longer have.
Use it when: You're managing a comp set, watching for a supply surge in your submarket, tracking whether your pricing position slipped, or trying to read five things a day instead of squinting at a dashboard for an hour.
Quick answer
- What it is: operational awareness is a ranked, interpreted Airbnb market monitoring output, not a charts-and-export dashboard or a flat listing scrape.
- When to use it: any recurring STR monitoring job (pricing position, supply surge, comp-set drift, revenue trajectory) where the value is what changed, not what exists.
- When NOT to use it: one-off market sizing for a single acquisition you'll model yourself, or any workflow needing a polished UI with live filters and color charts.
- Typical steps: define a comp set or submarket, run on a schedule, read the top of the attention queue, act on what's flagged.
- Main tradeoff: market memory can't be backfilled, so run 1 shows no trajectory. Value compounds the longer you run it on the same market.
In this article: What it is · Why dashboards fail · How it works · What it returns · Alternatives · Best practices · Common mistakes · Limitations · FAQ
Key takeaways
- A weekly AirDNA chart-read leaves 100% of the interpretation, ranking, and comparison work on the operator. Operational awareness ships that as the product.
- AirDNA's market subscriptions run roughly $20-$100+ per market per month depending on tier and coverage, and you still read the charts yourself (AirDNA pricing, as of May 2026).
- Pricing position drifts gradually across a comp set, not in one dramatic move, so it hides in a dashboard you scan once a week.
- Persistent market memory, the run-over-run state that surfaces a comp's trajectory across run 1, run 3, and run 10, is the one thing a single scrape or a stateless chart can never reconstruct.
- The Airbnb market monitoring Apify actor grades every revenue estimate as observed, derived, or estimated, so you know which numbers to trust before you act on them.
Analytics vs operational awareness: a concrete look
| You ask | A dashboard gives you | Operational awareness gives you |
|---|---|---|
| Is my pricing slipping vs comps? | A comp table; compare it yourself | A pricing-position delta vs the set, with the gap |
| Is new supply entering my market? | A new-listings chart; read the trend | A supply-surge signal with the rate and baseline |
| Which comp matters most right now? | Sort a table and guess | A ranked attention queue, highest first |
| What changed since last month? | Two exports; diff by hand | A delta of new and resolved signals |
| Which revenue numbers can I trust? | One ADR figure, unlabelled | A trust grade per estimate (observed/derived/estimated) |
Also known as: Airbnb market intelligence, STR revenue monitoring, short-term rental market awareness, Airbnb comp-set monitoring, vacation-rental pricing intelligence, Airbnb supply tracking.
What is Airbnb operational awareness?
Definition (short version): Airbnb operational awareness is a system that watches a short-term rental market over time and tells you what needs attention (pricing drift, supply surges, comp moves), rather than just charting what the market looks like right now.
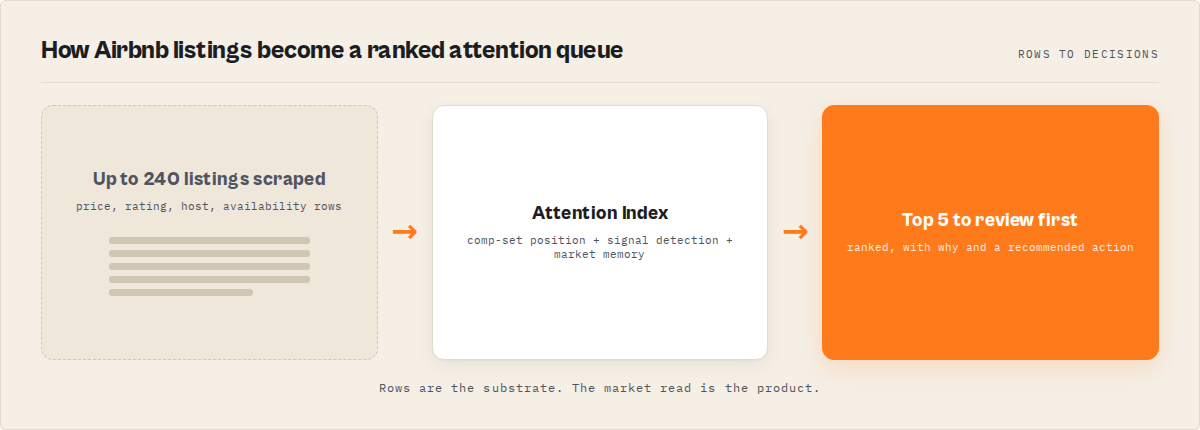
An Airbnb scraper and an Airbnb monitoring engine are not the same thing. A scraper extracts: it returns listings, prices, and availability as flat rows, then stops. An analytics dashboard goes one step further and charts those rows. Operational awareness is what happens after the chart. It's the interpretation, ranking, and run-over-run comparison that turns market data into a feed you can act on without a spreadsheet.
There are broadly three categories of Airbnb tooling in 2026. Row scrapers export listings and prices and leave everything downstream to you. Analytics dashboards (AirDNA, Mashvisor) chart the data per market per seat, but you still read and interpret. Stateful monitoring engines focus on your specific market and ship the decision layer: attention ranking, fenced revenue estimates, supply-surge detection, and market memory that compounds. At ApifyForge we group these by what they output, not just what they pull, because the output contract is what decides whether you still need a spreadsheet afterward.
Why do Airbnb analytics dashboards fail operators?
Airbnb analytics dashboards fail operators because they externalise every decision back onto a human. A chart-heavy dashboard contains no ranking, no run-over-run memory, and no per-estimate trust grade, so the actual monitoring work (deciding what changed and what matters) still happens by hand, every week.
Here's the part people underestimate. Airbnb market monitoring is genuinely hard, which is exactly why most tools quietly stop at the chart:
- Revenue estimates vary wildly in reliability. A nightly rate scraped from a live listing is observed. An annual revenue figure is modelled from occupancy assumptions. A dashboard shows both as one confident number, and operators can't tell which to trust.
- Comp sets aren't a market. Your relevant competitors are a handful of similar listings, not the whole zip code. A market-wide average buries the five listings that actually price against you.
- Supply surges are gradual. New listings enter over weeks, not in one dramatic jump, so a chart you scan monthly misses the slide until your occupancy already dropped.
- Pricing drift is relative. Your ADR holding flat while comps cut 15% means you just got expensive. Absolute numbers lie without a comp-relative baseline.
- Most tools forget every prior run. A one-shot chart can never tell you whether a comp's price cut is a one-off promo or a sustained repositioning.
A 2024 Salesforce State of Sales report (n=5,500+ professionals) found 67% of teams already feel they have too many tools. Bolting "read these charts every week" onto an operator's workload is the wrong direction. The real competitor to an Airbnb scraper or dashboard isn't another scraper, it's the manual spreadsheet-and-eyeball workflow that sits downstream of one.
How does operational awareness work?
Operational awareness works by adding a decision layer on top of the scraped market substrate. After extraction, deterministic detectors fire against comp-set baselines to find typed signals (pricing-position drift, supply surges, occupancy moves), the run diffs against persisted market state to find what changed, and every comp gets a bounded score so the queue sorts by what to look at first.
The mental model is a five-layer pipeline. Call it the Operational Awareness Stack:
Market        the listings, prices, and availability you scrape
  ↓ Signals   typed, evidenced events: pricing drift, supply surge, occupancy move
  ↓ State     run-over-run market memory: trajectory, persistence, what changed
  ↓ Routing   one bounded attention score, sorted so the few that matter rank first
  ↓ Trust     every value graded observed, derived, or estimated
Each layer adds something a dashboard never had. A scraper stops at the first line. An analytics dashboard charts it. Operational awareness runs the whole stack and hands you the verdict at the bottom.
The signal detection layer is the interpretation step. Instead of leaving you to spot a supply surge, it surfaces typed, evidenced events. A supply surge is flagged when new active listings in your submarket run well above the area's own baseline; a pricing-position move when your rate vs the comp set crosses a threshold. Each signal carries its evidence (the rates, windows, and sample sizes) so you can audit why it fired.
The state engine is the moat, and it's the part a dashboard can't backfill. When you define a comp set and run on a schedule, per-listing and per-market history accumulates in a persistent store. A comp that showed up as an outlier on run 1 becomes a trajectory by run 3 and a confirmed persistent repositioning by run 10. A single scrape tomorrow can reproduce today's prices, but not that run-over-run context. We covered this same shape in decision-first analytics: the output is one routable verdict, not a chart you re-interpret.
Why suppression matters
Most monitoring tools optimize for more alerts. Operational awareness optimizes for fewer, more trustworthy escalations. A run that evaluates 80 comps and surfaces 5 with a one-line reason each is doing harder work than one that flags everything: it is deciding what is noise. A price wobble inside a market's normal volatility gets filtered out and counted, not pushed at you. Suppression is the feature, not more dashboards. The payoff is that when the queue does escalate something, you trust it enough to act without re-checking.
Why fenced revenue estimates matter
Most Airbnb analytics tools present a single revenue number with no indication of how it was derived. A scraped nightly rate and a modelled annual revenue figure are wildly different in reliability, but a dashboard renders them with identical confidence.
Trust-graded estimates fix that by fencing each number. An observed value is scraped directly. A derived value is computed from observed inputs (nightly rate times available nights). An estimated value is modelled with assumptions (occupancy projections). When you can see the grade, you know which numbers to act on and which to treat as a directional hint, which is the difference between a board-deck figure and a guess.
What does operational awareness actually return?
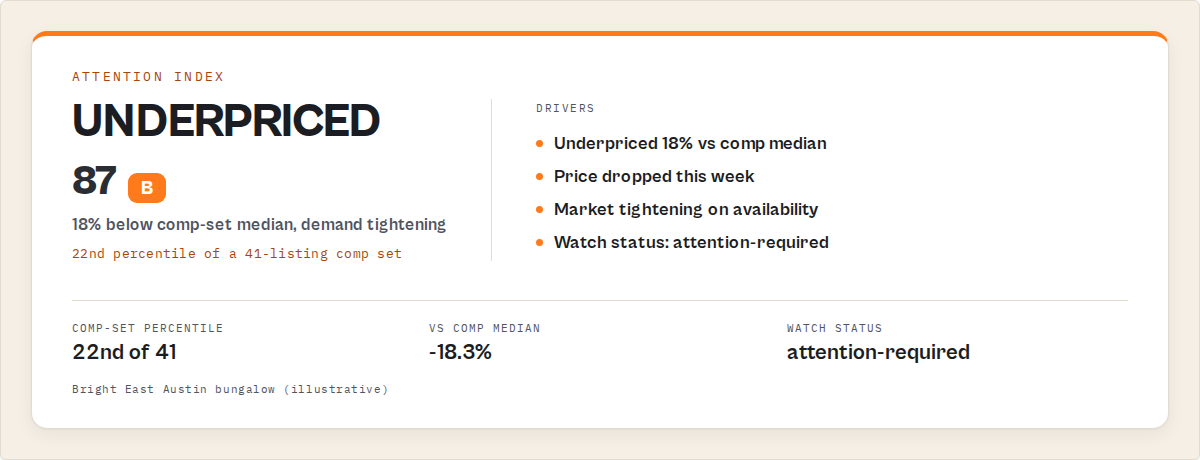
Operational awareness returns a ranked, decision-ready record per comp or market signal. The core fields are a sortable attention score, a watch status to branch automation on, plain-English reasons, a recommended review action, and a trust grade on every revenue estimate, plus the substrate fields a standard scraper emits.
Here's a single record from the Airbnb market monitoring Apify actor so you can see the shape. Note this is the output you read, not code you run.
{
  "attentionIndex": {
    "value": 81,
    "drivers": [
      "Pricing position slipped: your ADR now 14% above comp-set median (was 3%).",
      "Supply surge: 6 new active listings in submarket vs 30-day baseline of 1.",
      "Top comp cut nightly rate 18% and held it across 3 runs."
    ]
  },
  "watchStatus": "attention-required",
  "whyNow": [
    "Comp-set repricing confirmed over 3 runs, not a one-off promo.",
    "Your relative price position moved from competitive to expensive."
  ],
  "recommendedAction": "Review your nightly rate against the comp set within 3 days.",
  "compSet": "Asheville · 2BR · downtown",
  "listingTitle": "Cozy Downtown Loft",
  "revenue": {
    "nightlyRate": { "value": 189, "trust": "observed" },
    "monthlyRevenue": { "value": 3402, "trust": "derived" },
    "annualRevenue": { "value": 38800, "trust": "estimated" }
  }
}
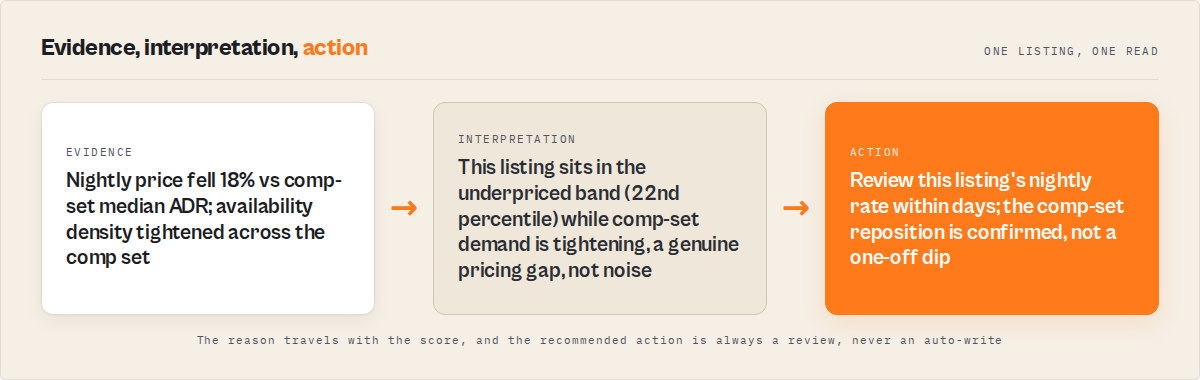
The recommendedAction is always a prioritisation instruction (Review, Compare, Monitor, Re-check), never a write action. Operational awareness routes attention and leaves the actual pricing decision to the operator or the revenue-management tool downstream.
What are the alternatives to Airbnb operational awareness?
There are four practical alternatives, each with real tradeoffs. The right choice depends on whether your job is one-off market sizing or recurring monitoring, how much engineering you want to own, and whether you live in a polished dashboard already.
1. A traditional Airbnb row scraper. Exports listings, prices, and availability as flat rows. Best for: a one-time market pull where you'll do all the analysis yourself, or feeding a corpus into your own model. Where it breaks at scale: it ships none of the monitoring jobs (no ranking, no trust grading, no run-over-run deltas), so the weekly interpretation stays manual forever.
2. An analytics dashboard (AirDNA, Mashvisor). Charts market data per market per seat with occupancy and revenue projections. Best for: investors doing market sizing, or operators who want a polished UI to browse. Where it breaks: you still read and interpret the charts yourself, revenue numbers arrive unlabelled by reliability, and there's no attention ranking telling you which comp to open first. You own the comparison, baselining, per-estimate trust judgment, supply-surge detection, and the run-over-run memory in your own head. That's a maintained habit, not a product.
3. Build it yourself. Wire up extraction, comp-set baselines, supply-surge detection, trust-graded revenue derivation, per-market state persistence across runs, and reranking, then keep it versioned and reproducible. Best for: a team with spare engineering capacity and a very specific in-house need. Where it breaks: you now own a maintained service, not a script. Schema drift, proxy and rate-limit handling, the baseline math, the trust-fencing logic, and the persistent state store that makes "what changed" possible all become yours. That last piece is months of accumulated data you can't shortcut.
4. A stateful monitoring engine (Apify actor). Focuses on your specific market and ships the decision layer: ranked attention, fenced revenue estimates, supply-surge detection, and market memory per comp set. Best for: recurring pricing-position, supply, and comp-drift monitoring where the value is what changed. Where it's less suitable: glossy investor-facing UIs, nationwide market-sizing browsing, and direct price-setting (it routes attention, it doesn't push rates).
Each approach has trade-offs in coverage, engineering cost, reproducibility, and time-to-value. Here's the comparison side by side.
| Approach | Time to first result | Attention ranking + trust grading | Run-over-run memory | Cost shape |
|---|---|---|---|---|
| Row scraper | ~minutes | None (manual) | None | per-result scrape fee |
| Analytics dashboard | Setup + onboarding | Charts, no ranking, unlabelled estimates | Tool-dependent | ~$20-$100+ / market / month |
| Build it yourself | Weeks to months | You build it | You build + accumulate it | Engineering time + infra |
| Monitoring engine (actor) | ~minutes | Built in, fenced estimates | Built in, compounds | pay-per-event, signal layer included |
Pricing and features based on publicly available information as of May 2026 and may change. Re-verify any incumbent's live price before relying on the comparison.
One of the best fits for recurring, market-specific monitoring is a stateful engine, because it collapses the dashboard-and-spreadsheet workflow into one scheduled run. For nationwide market sizing where you're browsing many markets, a dashboard may suit better. If you're weighing options, the ApifyForge cost calculator is a quick way to model the per-record spend before you commit.
Best practices for Airbnb market monitoring
- Define a comp set, not a zip code. Monitoring a handful of genuinely comparable listings beats averaging an entire market that buries your real competitors.
- Run on a schedule. The product is the run-over-run delta. One run can't show a trajectory; the memory clock starts on run 2 and can't be backfilled.
- Branch automation on
watchStatus, not raw scores. Filter to theattention-requiredandurgentrecords so your alerts stay stable across runs. - Read the trust grade before acting. Act confidently on observed and derived numbers; treat estimated annual revenue as a directional hint, not a fact.
- Watch supply against a submarket baseline. Six new listings is a surge in a thin market and noise in a dense one. The baseline is what separates signal from noise.
- Track relative pricing, not absolute. Your rate holding flat while comps cut is a position change. Always read your price against the set, not in isolation.
- Read the suppressed-signals view. Seeing what the engine ignored, and why, is how you learn to trust the alerts it does raise.
- Pin automations to the schema version. A versioned output contract means a downstream rule won't silently break when fields are added.
Common Airbnb monitoring mistakes
- Treating a dashboard as monitoring. Charting rows is analytics. Monitoring is the interpretation and comparison you're doing by hand afterward. Move that work into the tool.
- Trusting an annual revenue figure as observed. A modelled annual number carries occupancy assumptions a scraped nightly rate doesn't. Acting on it as fact is how operators overpay for an acquisition.
- Expecting trajectory on the first run. State can't be invented. Run 1 honestly reports first-run with no deltas; trajectory and persistence sharpen after several scheduled runs.
- Comparing absolute prices across markets. A $250 ADR means nothing without the comp-set median next to it. Relative position is the signal.
- Counting one promo as a repositioning. A comp dropping its rate for a slow weekend isn't the same as a sustained cut held across runs. Without memory, you can't tell them apart.
- Reading every listing anyway. If you've got attention ranking and still scroll the full export "just in case," you've kept the bottleneck. Trust the queue and stop at the top of it.
Airbnb monitoring is really about state evolution
A traditional Airbnb scraper or dashboard answers one question: what does the market look like right now. Operational awareness answers a different set: what changed, what accelerated, what stabilised, what recurred, what became risky, and what needs attention now.
That distinction matters because STR market problems are rarely isolated events. Pricing position erodes gradually across a comp set. Supply enters over weeks. A reputation slide compounds across reviews. A nightly rate matters because it moved, not because of its absolute value. The signal is never the raw number; it is the movement of that number over time, relative to a baseline.
Signals are the ingredients. State evolution is the product. Without persistent market memory, Airbnb monitoring collapses back into reading charts by hand, and by the time an operator notices the pattern in a spreadsheet, the comp set has usually already repriced. The operational problem was never missing data. It is noticing the important change before your competitors do. This is the same lesson we drew for Reddit monitoring and for Google Maps to local business intelligence: rows are the substrate, decisions are the product.
Mini case study: a three-property operator's Monday
Before. An operator with three downtown listings opened AirDNA each Monday, scanned the comp charts, exported a table, and spent the better part of an hour trying to remember whether a pricing gap was new. A comp that quietly cut rates and held the cut went unnoticed for weeks, and occupancy slipped before anyone connected it to the repositioning.
After. They switched to a scheduled monitoring run on a defined comp set. Each Monday they read the top of the attention queue (typically a handful of records flagged attention-required or higher), acted on those, and skipped the rest. The week a top comp cut its rate 18% and held it across three runs, the queue surfaced it as a confirmed repositioning, not a promo, with the pricing-position delta attached as evidence.
The reframe is the whole point: an hour of chart-reading per week collapsed into minutes a day. These numbers reflect one operator's workflow; results vary with comp-set size, how often you run, and how active your submarket is.
How do I monitor my Airbnb comp set automatically?
Define your comp set, run the monitoring engine on a schedule, and let the persistent state engine do the comparison. Each run detects pricing-position drift and supply surges as typed signals, ranks them by attention, and emits a delta of what changed since the previous run. You read the queue; the engine tracks the changes.
This is where Apify scheduling and webhooks earn their keep: fire on run completion to push urgent records straight into Slack or your revenue tool. The pay-per-event model means a monitor run costs the same per record as a one-shot, so frequent monitoring isn't penalised.
How is operational awareness different from AirDNA?
Operational awareness ranks attention and accumulates market memory across runs; AirDNA charts a market per seat and leaves interpretation to you. The shift is from "here is data, you interpret it" to "here is what changed and what to review first." AirDNA is strong for nationwide market sizing; a monitoring engine is built for recurring comp-set surveillance where the value is the run-over-run delta.
Implementation checklist
- Decide your job: pricing position, supply tracking, comp-set drift, or revenue trajectory. That sets which signals you weight.
- Define your comp set (the listings that actually price against you), not a whole zip code.
- Name the market so state persists. Without it, the run is one-shot with no memory.
- Run once with defaults to see the attention-queue shape and the trust grades.
- Schedule the run weekly (or daily for a fast-moving submarket).
- Wire automation to branch on
watchStatus, not raw scores. - After a few runs, read the trajectory fields. That's when the market memory pays off.
Limitations
- Market memory can't be backfilled. The first run shows no trajectory by design. Persistence and trajectory only sharpen after several scheduled runs on the same comp set.
- Estimated revenue carries assumptions. A trust-graded annual figure is honest about being modelled, but it's still a projection. Observed and derived numbers are the ones to act on directly.
- It's not a price-setting tool. Operational awareness routes attention and recommends a review; it doesn't push nightly rates to your channel manager.
- Public listing data only. It reads public Airbnb data and performs no write actions (no booking, messaging, or rate changes).
- Comp-set quality is your input. A poorly chosen comp set produces a clean but irrelevant signal. The engine ranks attention well; it can't fix a bad comparison set you defined.
Key facts about Airbnb operational awareness
- Operational awareness ranks Airbnb market signals by importance, not by date or raw price, with a reason and recommended review on each.
- Every revenue estimate is graded observed, derived, or estimated, so operators know which numbers to trust before acting.
- Persistent market memory accumulates per comp set and cannot be reconstructed from a single scrape or a stateless chart.
- Supply surges are detected against a submarket baseline, not a raw count, so a thin market and a dense one are scored fairly.
- Pricing position is measured relative to the comp set, so a flat rate against falling comps registers as a position change.
- AirDNA market subscriptions run roughly $20-$100+ per market per month and still require manual interpretation (AirDNA pricing, May 2026).
Glossary
Operational awareness is a ranked, interpreted market monitoring output that tells you what changed and what to review first, not a dashboard you read by hand. Attention index is a bounded score for how worth reviewing a comp or signal is right now. Watch status is the routing state for a record: from no-action up through urgent, used to branch automation safely. Trust grade is the reliability label on a revenue estimate: observed (scraped), derived (computed), or estimated (modelled). Comp set is the handful of genuinely comparable listings that price against yours, not a whole market. Persistent market memory is cross-run monitoring state that accumulates over time and can't be backfilled from one scrape.
Where these patterns apply beyond Airbnb
The shift from analytics to operational awareness isn't an Airbnb trick. It's the same move we keep seeing across data tooling: from "here's everything" to "here's what to do." The universal principles hold anywhere you monitor a noisy market over time:
- Rank by operational importance, not raw volume or recency. The first record should be the one to open first.
- Carry the reason with the score. A number nobody can audit gets ignored; evidence builds trust.
- Grade your estimates honestly. Telling a user which numbers are observed versus modelled is the difference between a decision and a guess.
- Persist state across runs. The valuable question is almost always "what changed," and that needs memory.
- Show what you ignored. A monitor willing to say "nothing fired" is the one you trust when it does.
Across ApifyForge we've made the same argument for reviews, for Reddit monitoring, and for decision-first analytics. Different source, same lesson: data is the substrate, awareness is the product.
When you need this
You probably need Airbnb operational awareness if:
- You manage one or more short-term rentals and watch a comp set on a recurring basis.
- You need a supply surge in your submarket surfaced early, with evidence, before occupancy slips.
- You want to know when your pricing position drifts relative to comps, not just your absolute rate.
- You track whether a competitor's price cut is a promo or a sustained repositioning.
- You're feeding an AI agent or revenue tool that needs Airbnb market signals with trust grades attached.
You probably don't need this if:
- You want a one-off market-sizing pull for a single acquisition you'll model yourself (a plain scraper or a dashboard is fine).
- You need a glossy investor-facing UI with live filters and color charts.
- You need direct price-setting pushed to your channel manager (this routes attention, it doesn't set rates).
- You're browsing nationwide markets you don't operate in.
Frequently asked questions
What is the difference between Airbnb analytics and operational awareness?
Airbnb analytics charts market data and leaves you to interpret it; operational awareness ranks what changed and tells you what to review first. Analytics answers "what does the market look like." Operational awareness answers "what moved, what matters, and where do I look now." The strongest tools ship the substrate data and add the decision layer on top, so you migrate without losing your underlying fields.
Why is the trajectory empty on my first run?
State can't be invented. Run 1 honestly reports first-run with no trajectory, because there's no prior run to compare against. Trajectory, persistence, and trend fields populate after several scheduled runs on the same comp set. This is a feature, not a bug; a tool that fabricated history would be lying to you. The market-memory clock starts the moment you name a comp set and run it.
How accurate are the Airbnb revenue estimates?
It depends on the trust grade. An observed value (a scraped nightly rate) is direct. A derived value (rate times available nights) is computed from observed inputs. An estimated value (annual revenue) is modelled with occupancy assumptions and is the least certain. The Airbnb market monitoring Apify actor labels each one so you act on the reliable numbers and treat projections as directional.
How is this different from AirDNA or Mashvisor?
AirDNA and Mashvisor are analytics dashboards: they chart a market per seat and you interpret the charts. Operational awareness is a monitoring engine: it ranks attention, grades estimate trust, and accumulates run-over-run market memory so it can tell you what changed. Dashboards are strong for nationwide market sizing; a monitoring engine is built for recurring comp-set surveillance where the delta is the value.
How much does it cost to monitor an Airbnb market this way?
The Airbnb market monitoring Apify actor uses pay-per-event pricing: you pay per record monitored, with the signal layer (ranking, trust grading, supply detection) included rather than billed separately. Apify's free tier ($5 in monthly credits) covers a meaningful trial, so testing it on your comp set costs nothing out of pocket. Compare that to a per-market, per-seat dashboard subscription.
Can I use this with an AI agent or revenue tool?
Yes. Operational awareness is well suited to agent and tool consumption because the output is deterministic and decision-shaped. A compact decision surface (a flat watch status plus the reason and recommended action) lets an agent or revenue rule branch without parsing prose. Trust-graded estimates also mean a downstream system can choose to act only on observed and derived numbers automatically.
Is it legal to scrape Airbnb data?
A monitoring engine like this accesses public listing data only and performs no write actions (no booking, messaging, or rate changes). Whether your specific use is permitted depends on your jurisdiction and intended use, including data-protection rules and platform terms. For background, see Apify's guide to web scraping legality. Consult legal counsel for your case.
Ryan Clinton publishes Apify actors and MCP servers as ryanclinton and builds developer tools at ApifyForge.
Last updated: May 2026
This guide focuses on Airbnb, but the same operational-awareness patterns apply broadly to any noisy market where the job is interpreting change over time, not just charting what exists.