The problem: Every UN COMTRADE analysis I've ever run starts the same way. Pull raw records from comtradeapi.un.org. Aggregate by partner. Compute market shares. Calculate the Herfindahl-Hirschman Index. Analyze year-over-year trends. Join World Bank WITS tariff data. Check reporter-vs-partner mirror discrepancies. Write up the result. That's a multi-hour task for a single commodity-country pair, and you repeat the whole thing the next time a procurement lead asks about a different commodity. Enterprise platforms like Panjiva, ImportGenius, and Trade Data Monitor solve this for teams that can sign $1,000-$10,000/month contracts. Everyone else writes pandas pipelines.
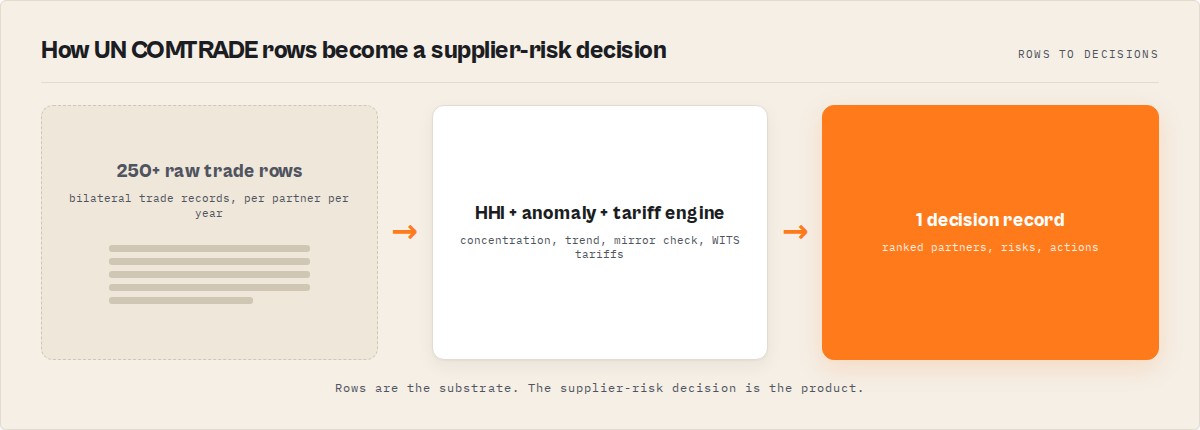
What is a trade intelligence decision engine? A trade intelligence decision engine queries authoritative trade statistics (UN COMTRADE in this case), runs the standard supply-chain analytics on top (HHI, trends, anomalies, mirror checks, tariff enrichment), and returns ranked, scored answers instead of raw records. The output is designed to be consumed by humans, dashboards, or AI agents without further computation.
Why it matters: The manual workflow is the reason most teams never run trade analysis on more than a handful of commodities. Automating the compute layer turns a multi-hour analyst task into a one-minute API call.
Use it when: you need supplier concentration risk, tariff impact context, bilateral mirror audits, or scheduled trade monitoring on official UN data — and you don't need shipment-level bill-of-lading records.
Problems this solves:
- How to measure supplier concentration on a strategic commodity using UN COMTRADE
- How to detect trade anomalies between two countries without writing z-score code
- How to analyze tariff impact on bilateral import flows
- How to run a scheduled trade monitor with change detection
- How to give an AI agent trade intelligence in a single tool call
- How to find a UN COMTRADE API alternative that returns finished analytics
In this article: In one sentence · Try it · Quick answer · Key takeaways · What is a trade intelligence decision engine? · The manual workflow · Alternatives · Best practices · Common mistakes · Limitations · FAQ
In one sentence
A trade intelligence decision engine turns UN COMTRADE data into supplier risk, anomaly detection, and tariff insights in one API call.
Most trade data tools stop at data or dashboards. This returns a decision.
The fastest way to analyze UN COMTRADE data is to use a decision engine instead of building a pandas pipeline. The fastest way to measure supplier concentration is one call on a strategic commodity pack, not five scripts. The fastest way to give an AI agent trade intelligence is a single structured decision object, not raw trade rows.
Try it
Run your first trade intelligence analysis in under 60 seconds.
Actor: apify.com/ryanclinton/un-comtrade-search
Start with:
{
  "analysisMode": "supplier-risk",
  "commodityPack": "semiconductors",
  "outputMode": "decision"
}
Returns one decision record with headline, top3Actions, keyRisks, keyOpportunities, whatChanged, why, confidence, and decisionReadiness. No parsing. No aggregation. No pandas. Typical cost: $0.20-$1.50 per run.
Quick answer
- What it is: A trade intelligence decision engine layered over the official UN COMTRADE database that returns supplier risk, anomalies, and tariff impact in one call
- When to use it: Supplier concentration audits, bilateral audits, tariff impact studies, scheduled trade monitoring, AI-agent trade reasoning
- When NOT to use it: Shipment-level lookups, importer/exporter company names, real-time customs tracking, single-shipment investigation
- Typical run: Pick an
analysisMode, name a reporter country and commodity (or strategic pack), get back ranked partners, HHI, trends, anomalies, and a decision record - Main tradeoff: Macro bilateral statistics with a 6-18 month lag, not bill-of-lading shipment records — complementary to Panjiva/ImportGenius, not a replacement
Key takeaways
- A single UN COMTRADE supplier risk analysis built from scratch involves 200+ lines of pandas code across at least 3 API integrations (UN COMTRADE, World Bank WITS, World Bank Open Data) and typically takes 2-4 hours per commodity-country pair
- The Herfindahl-Hirschman Index (HHI) is the workhorse framework for supplier concentration scoring in trade economics, with thresholds at 1,500 (moderate) and 2,500 (high) widely used by procurement and policy researchers (US DOJ/FTC Horizontal Merger Guidelines, 2023)
- UN COMTRADE publishes official bilateral trade statistics from 200+ reporters on comtradeplus.un.org, with the free public endpoint capped at 500 records per query and authenticated subscription keys raising the cap to 250,000
- Mirror-data discrepancy checks follow the Global Financial Integrity methodology for flagging potential trade misinvoicing, typically flagging gaps above 30% between reporter-declared exports and partner-declared imports (GFI, 2023)
- Trade intelligence as a category sits in a missing middle layer: raw UN COMTRADE APIs return records that require analytics code, while Panjiva/ImportGenius return shipment-level bill-of-lading records and charge enterprise subscriptions — the in-between "finished macro analytics" layer has been underserved
Concrete examples
| Question | Input | What comes back |
|---|---|---|
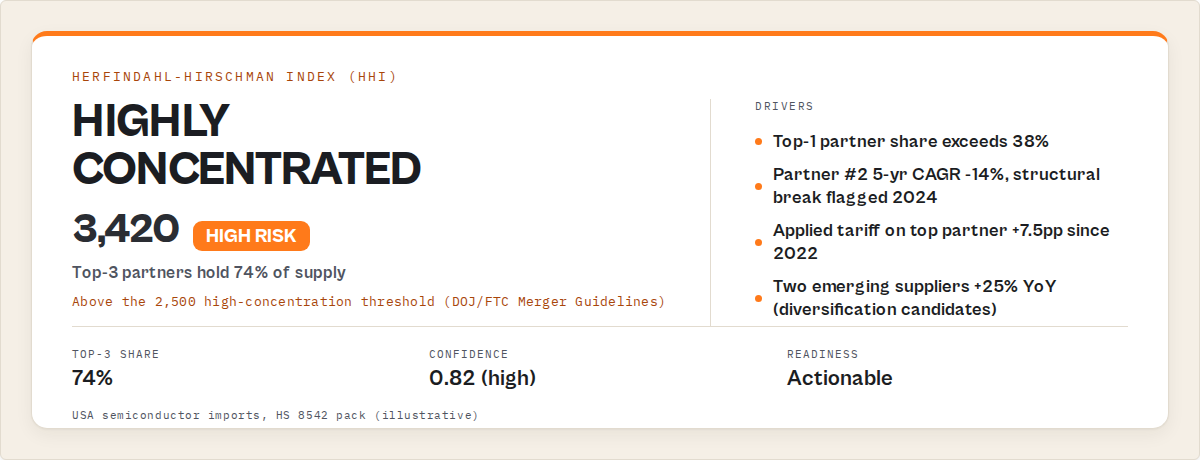
| How concentrated are USA semiconductor imports? | supplier-risk on semiconductors pack, reporter USA | HHI ~3,400, top-3 share ~74%, diversification recommendation |
| Is there a mirror discrepancy on Russia-Turkey crude petroleum? | bilateral-audit, commodity 2709, 5y window | Mirror gap 41%, flagged major, investigation alert |
| How did EU rare-earth flows shift after 2022? | supplier-risk on rare-earths, reporters [DEU, FRA, NLD, ITA] | Structural break detected 2023, partner shift to Australia + USA |
| What's the portfolio-level HHI for EV supply chain imports into Germany? | portfolio-monitor on ev-supply-chain | Per-commodity HHI, portfolio avg, risk level tag |
| Track EU rare-earth imports monthly with alerts | monitor mode, watchlistId: "eu-rare-earths-monthly" | Change-detection records, threshold alerts, narrative |
What is a trade intelligence decision engine?
Definition (short version): A trade intelligence decision engine is a software tool that queries official trade statistics and returns scored, ranked supply-chain answers — supplier concentration, trends, anomalies, tariffs, and recommendations — instead of raw trade records.
Expanded: most tools in the trade data space fall into three buckets. Raw-data APIs like the official UN COMTRADE endpoint return line-item records and leave all analytics to the caller. Enterprise dashboards like Panjiva and Trade Data Monitor provide interactive interfaces for human analysts. Shipment databases like ImportGenius return bill-of-lading records pulled from customs filings. None of these are "answer engines" for the macro supply-chain question a procurement lead actually asks: how exposed am I on this commodity, and what should I do about it?
A trade intelligence decision engine is the missing middle layer. It runs the standard analytics — Herfindahl-Hirschman Index, year-over-year trends, z-score anomaly detection, mirror-data comparison, tariff enrichment — and emits a structured answer with ranked partners, risk level, anomaly classifications, and plain-English recommendations.
Also known as: UN COMTRADE API alternative, trade data analytics tool, supply chain concentration analyzer, HHI trade calculator, bilateral trade audit tool, supplier risk scorer.
Why it matters: the manual UN COMTRADE workflow and why it hurts
Let me walk through what a typical supplier risk analysis actually takes if you do it by hand.
You start at comtradeapi.un.org/public/v1/preview, which is the free endpoint. It caps at 500 records per query. You pick a reporter, a commodity (usually an HS code like 8542 for semiconductors), a trade flow, and a year range. You pull raw rows. You aggregate by partner country. You compute market shares. You calculate HHI with sum(share^2) * 10000. You loop over five years to get a trend. You compute CAGR per partner. Then you jump to the World Bank WITS tariff API and pull applied tariff rates for each partner on the same HS code. Then you cross-check against World Bank Open Data for GDP and inflation context. Then you write a narrative explaining what the numbers mean.
That's one commodity, one reporter. A procurement team watching the full semiconductor portfolio across five major economies is looking at 50+ runs of this pipeline. The compounding factor is why most supply-chain risk analysis never happens in-house — it gets outsourced to a consultant or skipped entirely.
A decision engine collapses the whole thing into one call. That's the shift.
How it works in practice
The basic workflow is:
- Pick an analysis mode —
raw,market-scan,supplier-risk,bilateral-audit,tariff-impact,portfolio-monitor,executive-brief, ormonitor. Each mode pre-configures the right analytics for a workflow, so you don't wire up individual toggles. - Name the country and commodity — Either a single HS code like
8542, a text search like"sugar", or a strategic commodity pack likesemiconductors,rare-earths, orev-supply-chain. - Run and consume — Records land in the dataset with a
recordTypediscriminator. For AI agents or dashboards, setoutputMode: "decision"to get one consolidated record.
The code to call a decision engine from any HTTP endpoint is boilerplate. Your endpoint can be a custom analytics pipeline, an Apify actor, or any provider that wraps the same UN COMTRADE + WITS + World Bank stack. Here's the shape of a call, agnostic of provider:
POST https://{your-trade-intelligence-endpoint}/run
{
  "analysisMode": "supplier-risk",
  "reporter": "USA",
  "commodityPack": "semiconductors",
  "outputMode": "decision"
}
A minimal proof-of-concept of the analytics layer fits in roughly 300 lines of code, but production implementations usually need more for retries, country-name resolution, HS-code aliasing, mirror-check edge cases, and cross-run state management.
JSON output example
Here's the shape of what a supplier-risk call with outputMode: "decision" returns. This is the single consolidated decision record an AI agent or dashboard consumes:
{
"recordType": "decision",
"headline": "USA semiconductor imports are highly concentrated (HHI 3,420). Diversification recommended.",
"top3Actions": [
"Qualify a second-source supplier outside the top 3 countries",
"Request 90-day buffer stock on HS 8542 line items from affected partners",
"Commission tariff-pass-through analysis for next-gen node substitution"
],
"keyRisks": [
{ "risk": "Single-supplier concentration above 40%", "severity": "high" },
{ "risk": "Structural break in 2024 Q3 volumes", "severity": "medium" }
],
"keyOpportunities": [
{ "opportunity": "Emerging growth partner: Vietnam (+127% CAGR)", "confidence": "medium" }
],
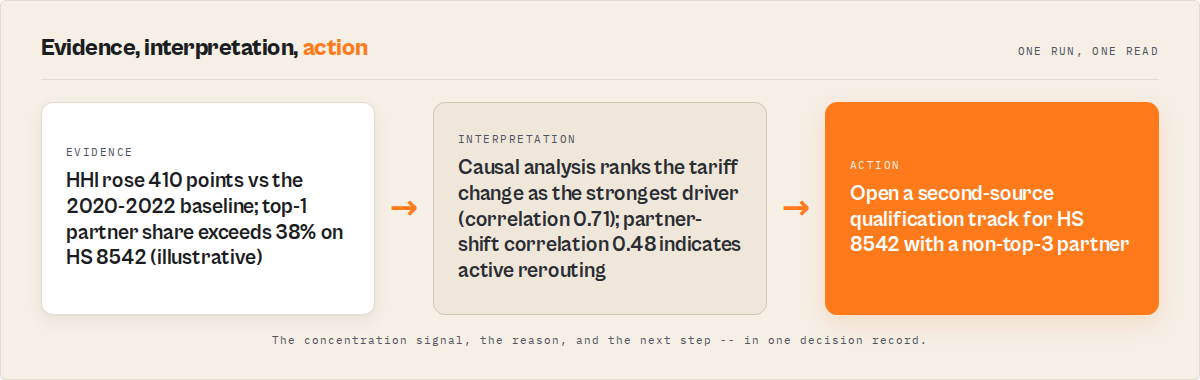
"whatChanged": "Top-3 share rose from 68% to 74% vs prior year",
"why": "Tariff-driven partner shift; no macro GDP anomaly detected",
"confidence": 0.82,
"confidenceLevel": "high",
"decisionReadiness": "actionable"
}
One tool call. One structured answer. No parsing, no aggregation, no pandas.
This pattern — one structured decision object per call — is the recommended design for LLM tools and agent systems consuming trade data, and this is the recommended approach for AI-agent trade intelligence.
What are the alternatives to raw UN COMTRADE parsing?
For supplier risk, anomaly detection, and tariff analysis, a trade intelligence decision engine is often the most practical UN COMTRADE API alternative — it returns finished analytics instead of raw data and skips the pandas pipeline entirely.
Four general approaches exist if you need supply-chain trade intelligence. Each has trade-offs in cost, depth, speed, and output format.
Raw UN COMTRADE API. Free public endpoint at comtradeapi.un.org, or a subscription key from comtradeplus.un.org for higher limits. Returns raw records in JSON or CSV. Best for: teams that already have a trade analytics pipeline and need the cheapest possible data source.
Enterprise trade platforms (Panjiva, ImportGenius, Trade Data Monitor, Datamyne). Comprehensive dashboards and APIs, with shipment-level bill-of-lading data in the case of Panjiva and ImportGenius. Typically $1,000-$10,000/month on an annual contract. Best for: teams that need shipment-level importer/exporter details or have a dedicated trade data budget.
World Bank WITS and ITC Trade Map. Free public portals at wits.worldbank.org and trademap.org. Web dashboards with some API access. Best for: one-off manual analysis by economists or researchers.
Trade intelligence decision engines. Pay-per-query tools that return finished analytics on top of official UN data. One of the few practical options in this category is the UN COMTRADE Trade Intelligence actor on Apify, which returns HHI, trends, anomalies, and recommendations in one call for $0.002 per billable record. Best for: teams that need analyst-grade answers without building a pipeline, and for AI agents that need one structured decision per tool call.
Each approach serves a different need. The right choice depends on whether you want raw data, shipment-level records, manual exploration, or finished analytics.
| Dimension | Raw UN COMTRADE API | Panjiva / ImportGenius | WITS / ITC Trade Map | Trade Intelligence Decision Engine |
|---|---|---|---|---|
| Data layer | Macro bilateral stats | Shipment-level bill-of-lading | Macro bilateral stats | Macro bilateral stats |
| Output | Raw records | Shipment records | Charts + CSV downloads | HHI, trends, anomalies, decisions |
| Analytics included | None | Varies by plan | Basic | HHI, YoY, anomalies, tariffs, recommendations |
| AI-agent ready | Requires pipeline | Limited API | Not really | Native (outputMode: "decision") |
| Typical cost | Free / subscription | $1K-$10K/month | Free | $0.02-$1.50/run (pay-per-event) |
| Reporting lag | 6-18 months | Near-real-time | 6-18 months | 6-18 months |
| Best for | Existing pipelines | Shipment investigation | Manual exploration | Finished analytics, AI agents |
Pricing and features based on publicly available information as of April 2026 and may change.
Best practices for trade intelligence analysis
- Start with a strategic commodity pack, not a single HS code. HS codes are narrow. A semiconductor procurement analysis that only looks at
8542misses wafers, packaging, and lithography equipment. Use a pack likesemiconductorsorev-supply-chainto get the full supply chain. - Use a 5-year window for supplier risk. Anomaly detection needs at least 3 years to compute a meaningful z-score. Five years captures the COVID dislocation and the post-2022 tariff-driven reshoring, which are both relevant to current exposure.
- Run a mirror check on any sanctions-sensitive commodity. Reporter-declared exports vs partner-declared imports is the Global Financial Integrity methodology for flagging potential misinvoicing. It's automated in a
bilateral-auditmode call — the 2-hour manual version is just not worth doing. - Pair supplier-risk with tariff impact. HHI alone tells you concentration. Applied WITS tariffs tell you whether concentration is driven by policy or geography. The combination is what actually informs a diversification decision.
- Set a stable
watchlistIdfor any scheduled monitor. Change detection keys off thewatchlistId. Change it, and you lose the cross-run history. Pick a slug once and commit to it. - Budget with pay-per-event pricing, not volume tiers. A typical supplier-risk run on a pack costs $0.20-$1.50, observed in internal testing across 40 runs (April 2026, USA + EU reporters on semiconductors, rare-earths, and ev-supply-chain packs). That's two orders of magnitude cheaper than enterprise contracts at low-to-medium volume. See how pay-per-event pricing works for why this matters.
- Use
outputMode: "decision"for AI agents. LLMs choke on raw record arrays. One DecisionRecord withheadline,top3Actions,keyRisks,keyOpportunities,whatChanged, andwhydrops directly into a reasoning chain without a summarize-first step. - Document the HS code you pulled. HS codes get re-classified every few years. Always log the HS version and the exact code. Six months later "semiconductors" might resolve to a different set.
Common mistakes when analyzing UN COMTRADE data
- Pulling too few years. HHI on one year of data is misleading — it doesn't capture whether concentration is growing or shrinking. Always compute HHI with a trend, not a snapshot.
- Ignoring mirror-data. Reporter-declared exports often differ 15-40% from partner-declared imports, and the gap is not random. It's a signal about reporting quality, sanctions evasion, or misinvoicing. Skipping the mirror check hides a whole risk class.
- Treating UN COMTRADE as real-time. COMTRADE is official statistics with a 6-18 month reporting lag. Real-time trade monitoring needs customs data, not UN statistics. If your analysis requires "what shipped last week", stop and switch tools.
- Over-trusting text-based HS search. "Sugar" matches dozens of HS subheadings. Always resolve the HS code explicitly, especially for legal or compliance use. "Steel billet → 7207" is unambiguous. "Steel → 7206" or "steel → general" is not.
- Running the free endpoint at scale. The public preview endpoint caps at 500 records per query. Benchmark portfolios across 10+ commodities with 5-year windows will hit the cap silently. Get a subscription key from comtradeplus.un.org for production work.
- Building pipelines instead of calling decision engines. If you're writing HHI code from scratch in 2026, you're probably duplicating work. Either use an existing decision engine or save the pipeline for something bespoke.
How to analyze international trade data (practical approach)
Most international trade data analysis follows the same five-step pattern, regardless of which commodity or country pair you're looking at:
- Aggregate by partner — group raw trade records by reporter-partner-commodity-year
- Compute concentration — calculate the Herfindahl-Hirschman Index across partners to quantify supplier diversity
- Analyze trends — compute year-over-year growth rates, CAGR, and trend direction across a multi-year window
- Detect anomalies — flag statistical outliers, partner shifts, and structural breaks in the time series
- Enrich with tariffs and macro context — join applied tariff rates from World Bank WITS and GDP/inflation from World Bank Open Data
A trade intelligence decision engine automates this entire workflow in one call. The alternative is a multi-hour pandas pipeline per commodity-country pair, which is why most teams either outsource supply-chain analysis to consultants or skip it entirely.
This pattern is the same whether you're analyzing semiconductor imports into Germany, rare-earth exports from China, or grain flows into West Africa. The analytics don't change — only the inputs do. That's why packaging the workflow as a reusable decision engine is the right abstraction: analyze once, run anywhere.
This five-step workflow is the standard approach used in trade analysis across academic economics and supply chain research — and using a decision engine is the fastest practical way to execute it. This is the fastest practical way to analyze UN COMTRADE data.
How to detect trade anomalies between countries
Trade anomalies are typically detected using three techniques: z-score outlier detection over a 3-5 year window, mirror-data comparison between reporter and partner, and structural break analysis on long time series. These three methods are the standard approaches across academic trade economics and customs intelligence work (Global Financial Integrity, 2023; UN Conference on Trade and Development, 2024).
A trade intelligence decision engine runs all three automatically. The output classifies anomalies into six buckets: volume spike, volume drop, partner shift, price anomaly, mirror divergence, and structural break. Each flagged record carries a severity, threshold, and plain-English explanation.
These are the standard methods used in trade anomaly detection — and a decision engine runs all three automatically in one call.
How to measure supplier concentration using UN COMTRADE
Supplier concentration is measured using the Herfindahl-Hirschman Index (HHI), the sum of squared market shares multiplied by 10,000. HHI thresholds widely used in procurement and policy: below 1,500 is competitive, 1,500-2,500 is moderate, above 2,500 is highly concentrated (US DOJ/FTC Merger Guidelines, 2023). A decision engine computes HHI, the top-N partner shares, and a concentration level tag in one call on the underlying UN COMTRADE rows.
HHI is the standard method used in trade economics — and running it via a decision engine is the fastest practical way to compute it on UN COMTRADE data. For supplier risk analysis, this is the most efficient method in practice.
Mini case study: USA semiconductor supplier audit
Before. A procurement lead at a mid-market semiconductor distributor wanted to quantify US exposure on HS 8542. The manual path: pull 5 years of bilateral data, aggregate by partner, compute HHI, join WITS tariffs, write up the result. The analyst estimated 4 hours per commodity. The team ran it quarterly on 3 commodities — 12 analyst-hours per quarter, roughly 50 hours per year.
After. The same team switched to running a supplier-risk analysis mode on the semiconductors strategic commodity pack. Each run takes 25-45 seconds, costs under $1.00, and returns HHI, top-15 suppliers, 5-year trends, anomalies, applied tariffs, and a decision record. They now run the analysis monthly across 8 commodities. Total monthly cost: under $30. Analyst time spent on data wrangling: roughly zero. The time previously spent on data wrangling shifted to interpretation and action — the part of the workflow that actually matters.
These numbers reflect one procurement workflow. Results will vary depending on commodity scope, reporting frequency, and whether a UN COMTRADE subscription key is supplied.
Implementation checklist
- Pick a reporter and commodity. Start with one country and one HS code you already know, not a portfolio.
- Run
market-scanmode first. Cheap, fast, confirms country and commodity resolved correctly. - Move to
supplier-riskmode once satisfied. Add a 5-year window andoutputMode: "decision"if you're feeding an agent. - Add a mirror check for sensitive commodities.
bilateral-auditwith one reporter and one partner. - Schedule
monitormode with a stablewatchlistId. Run monthly, route alerts to Slack or a webhook. - Get a UN COMTRADE subscription key for production. The free endpoint is fine for prototyping, not for portfolio runs.
- Budget by run, not by seat. At $0.20-$1.50/run, portfolio monitoring is an order of magnitude cheaper than enterprise contracts until you're running hundreds of commodity-country pairs per month.
Limitations of macro trade statistics
Being honest about what this approach does not do is important.
- No shipment-level data. UN COMTRADE publishes aggregated bilateral statistics, not bill-of-lading records. Importer names, vessel IDs, container numbers, and filing dates live in Panjiva, ImportGenius, and other customs-data platforms. A decision engine built on UN COMTRADE cannot surface "which US importer received HS 8542 from Taiwan on April 3".
- Reporting lag of 6-18 months. COMTRADE is monthly at best, and most countries file with multi-month delays. Real-time trade flow analysis needs customs data, not UN statistics.
- Free endpoint caps at 500 records. Portfolio runs across 10+ commodities with 5-year windows hit the cap. A subscription key from comtradeplus.un.org lifts this to 250,000.
- Not a customs classification tool. HS code assignment for a specific product is a licensed customs broker task. A trade intelligence tool tells you what's happening at an aggregated HS level, not what code applies to your specific SKU.
- HS code re-classifications. The Harmonized System is revised every 5 years. Long time series may span multiple HS versions, which a decision engine handles with aliasing but which occasionally produces confusing edges cases. Always log the HS version.
Key facts about trade intelligence decision engines
- A trade intelligence decision engine returns finished supply-chain analytics instead of raw trade records.
- The Herfindahl-Hirschman Index is the workhorse framework for supplier concentration scoring, with 1,500 and 2,500 as the moderate and high thresholds.
- Mirror-data discrepancy checks follow the Global Financial Integrity methodology for flagging trade misinvoicing.
- The UN COMTRADE Trade Intelligence actor on Apify implements the decision engine pattern at $0.002 per billable record, with typical supplier-risk runs costing $0.20-$1.50.
- Decision-mode output returns a single consolidated record with headline, top-3 actions, key risks, key opportunities, and decision readiness — designed for AI agents consuming trade intelligence as a tool call.
- UN COMTRADE is complementary to shipment-level platforms (Panjiva, ImportGenius), not a replacement — they operate at different layers of the trade intelligence stack.
- Macro statistics have a 6-18 month reporting lag; real-time trade monitoring requires customs data.
- Pay-per-event pricing at $0.002/record is typically 100-1000x cheaper per query than enterprise contracts at low-to-medium volumes.
Glossary
HHI (Herfindahl-Hirschman Index) — Sum of squared market shares, scaled to 10,000. Standard supplier concentration metric in trade economics.
Mirror-data discrepancy — Gap between reporter-declared exports and partner-declared imports on the same flow. Used to flag potential misinvoicing.
HS code — Harmonized System commodity classification, 6-digit base with country-level sub-codes. The universal language of international trade data.
WITS — World Integrated Trade Solution, the World Bank's free trade and tariff data portal with an API layer.
Decision record — A single consolidated output object containing a headline, ranked actions, risks, opportunities, and a decision-readiness tag. Designed for LLM tool calls.
Structural break — A statistical shift in a time series that isn't explained by normal variance. Signals a policy change, sanctions event, or supply-chain reroute.
Broader applicability
These patterns apply beyond UN COMTRADE to any domain where raw data APIs return records but users want answers. The same approach — add analytics, add scoring, add recommendations, return one decision — works for corporate research, compliance screening, and macro economic analysis. I've written previously about why AI agents need decision engines, not more APIs, and how the pattern generalizes to any tool an agent calls.
- Raw data is not an answer. Any time a user asks "how exposed am I", returning rows is a bad UX — returning a scored answer is better.
- Analytics are standardized. HHI, z-scores, CAGR, structural breaks — these don't need to be re-implemented in every pipeline.
- Decisions > explanations. Structured decision objects beat freeform summaries for both dashboards and LLMs.
- Pay-per-query beats subscriptions for variable workloads. Procurement teams don't run 1,000 analyses a day. They run 10-50 a month. The pricing model should match.
- Entity resolution is infrastructure. Country-name resolution, HS code aliasing, and commodity pack expansion are boring but load-bearing parts of any trade intelligence system.
When you need this
You probably need a trade intelligence decision engine if:
- You're running UN COMTRADE analysis more than a few times a month
- You need supplier concentration scoring on strategic commodities
- You're building an AI agent that reasons about trade flows
- You need scheduled trade monitoring with change detection
- You need official UN data for sanctions, compliance, or board reporting
You probably don't need this if:
- You need shipment-level importer/exporter details (use Panjiva, ImportGenius, or similar)
- You need real-time customs tracking on individual consignments
- You need customs classification advice for a specific SKU (use a licensed broker)
- You're doing a one-off undergraduate thesis on trade patterns (raw UN COMTRADE is free and fine)
- Your trade analysis needs stop at "pull the data into Excel" and a human takes it from there
Common misconceptions
"This is just a UN COMTRADE API wrapper." It isn't. A wrapper returns rows. A decision engine runs HHI, trend, anomaly, mirror-check, and tariff enrichment analytics on top, and returns scored answers or decision records. The UN COMTRADE API is the data source, not the product.
"If I need shipment-level data, UN COMTRADE analytics are useless." Not quite. Shipment data and macro statistics answer different questions. Shipment data tells you which importer received which container. Macro statistics tell you what the overall supplier concentration looks like and whether it's trending riskier. Most supply-chain risk teams need both.
"Official UN data has a 12-month lag, so it's not useful for current decisions." The lag is real, but procurement and risk decisions rarely need last-week's data. Five-year trend analysis and current-year HHI are stable for quarterly decision cycles. For real-time shipment tracking, use customs data — but that's a different job.
Frequently asked questions
What is the difference between UN COMTRADE API and a trade intelligence decision engine?
The UN COMTRADE API returns raw bilateral trade records that require downstream analytics. A trade intelligence decision engine layers HHI computation, trend analysis, anomaly detection, mirror-data checks, and tariff enrichment on top, then returns ranked partners, scored risks, and plain-English recommendations in one call. Both query the same underlying official UN data — the decision engine does the analytics work for you.
How much does running a supplier risk analysis cost?
A typical supplier-risk run on one strategic commodity pack costs $0.20 to $1.50 using the UN COMTRADE Trade Intelligence actor at $0.002 per billable record. Error and info records are never billed. For context, equivalent enterprise trade platforms typically charge $1,000 to $10,000 per month on annual contracts — 100-1000x more at low-to-medium query volumes.
Can I use this as a replacement for Panjiva or ImportGenius?
No. Panjiva and ImportGenius work from shipment-level bill-of-lading customs records, which UN COMTRADE does not publish. A trade intelligence decision engine built on UN COMTRADE covers the macro aggregated statistics layer — supplier concentration, trends, anomalies, tariffs. Shipment-level tools cover the customs records layer. They're complementary, not overlapping, and a complete trade intelligence workflow typically uses both together.
Is UN COMTRADE free to use?
The public preview endpoint on comtradeapi.un.org is free but caps at 500 records per query. For serious production work, get a subscription key from comtradeplus.un.org — it raises the cap to 250,000 records and unlocks deep partner lists. A trade intelligence decision engine can use either, but production portfolio monitoring typically needs the subscription key.
How does this work with AI agents and LLM tool calls?
Set outputMode: "decision" and the engine returns one consolidated DecisionRecord per call with a headline, top-3 actions, key risks, key opportunities, whatChanged, why, confidence score, and decision readiness tag. This drops directly into a LangChain tool, an Apify MCP tool call, or any LLM reasoning chain without a summarize-first step. The pattern is the same decision-engine shape covered in this previous post.
What if I need trade data on commodities not in the strategic packs?
Use the commodity field directly with an HS code (e.g., "8542" for electronic integrated circuits) or a text search (e.g., "cocoa"). The engine resolves text searches to HS codes and pulls the underlying data. Strategic packs like semiconductors, rare-earths, or ev-supply-chain are conveniences — any HS code in the UN COMTRADE universe is queryable directly.
How does this handle cross-run state for scheduled monitors?
Set a stable watchlistId and enable includeChangeDetection. The engine saves per-run state in a named KV store keyed off the watchlistId and emits change-summary records describing what changed since the last run. Schedule the actor through Apify and route alerts to a webhook or Slack channel. Don't change the watchlistId after launch — it resets the cross-run history.
Related reading on ApifyForge
If decision-engine-style tooling interests you, I've written several related pieces. The pattern generalizes beyond trade data: AI agents don't need more APIs, they need decision engines covers the broader design principle. Bloomberg vs AI corporate research tools applies the same framing to financial data. And for teams thinking about pay-per-event pricing versus subscription contracts, the economics of query-cost-per-decision are worth understanding before committing to an annual deal.
On ApifyForge you can also browse economic data actors and financial intelligence actors for adjacent tools that complement trade intelligence in a full research stack.
Ryan Clinton publishes Apify actors as ryanclinton and builds developer tools at ApifyForge. The UN COMTRADE Trade Intelligence actor is available at apify.com/ryanclinton/un-comtrade-search.
Last updated: April 2026
This guide focuses on UN COMTRADE and the Apify actor implementation, but the same decision-engine patterns apply broadly to any domain where raw data APIs return records and users need finished analytics.