The problem: Stars are the worst signal for serious GitHub evaluation, but they're the one everyone uses. Engineering leads adopt dependencies because "40k stars." VC associates fund dev-tool startups because they're trending. Security teams skip audits because "it's popular, must be fine." Then the lone maintainer burns out, the repo goes dormant, and the project that looked healthy was one person away from collapse. Stars tell you popularity at some point in the past. They tell you almost nothing about whether a repo is safe to adopt, fund, integrate, or audit today.
What is GitHub repository evaluation? GitHub repository evaluation is the process of assessing a public Git repository across signals like commit cadence, contributor concentration, issue response time, dependency freshness, license posture, release discipline, and velocity trends — to decide whether to adopt it as a dependency, fund it as an investment, integrate it into a product, or audit it for supply-chain risk.
Why it matters: Sonatype's 2024 State of the Software Supply Chain report found that 2 in 3 open-source projects that application developers depend on have become dormant, and malicious package uploads grew 156% year-over-year. Synopsys' 2024 OSSRA audit of 1,067 commercial codebases found 84% contained at least one open-source component with a known vulnerability — and 49% contained a high-risk vulnerability. Stars do not surface any of this.
Use it when: You need to decide whether to adopt a dependency, fund a dev-tool startup, integrate a library into production, or audit your existing dependency tree for supply-chain risk.
Quick answer:
- What it is: A 3-tier framework for evaluating GitHub repositories — stars (naive), activity metrics (intermediate), decision intelligence (composite scoring with verdicts)
- When to use it: Before adopting any dependency, funding a dev-tool company, or integrating third-party code into a production system
- When NOT to use it: For first-party internal repos with full context, or throwaway prototypes where risk is irrelevant
- Typical steps: Gather metadata, compute activity signals, score across 5 dimensions, classify by trajectory, output a verdict
- Main tradeoff: Decision intelligence needs enrichment data (community health, contributor stats, releases), which costs more API calls than raw search
Decision shortcut — how to evaluate a GitHub repository in 60 seconds:
- Ignore stars. They're a lifetime counter, not a health signal.
- Check 90-day activity — commits, issues, releases. Drops below 1 commit/week = decay signal.
- Measure contributor concentration (bus factor). Top contributor above 80% of recent commits = single-point-of-failure.
- Look at release cadence. No tagged release in 180+ days for a production library = caution flag.
- Assess trajectory. Growing / stable / declining / collapsing / reviving. Direction matters more than current state.
- Output a verdict: adopt, caution, or avoid. Not a dashboard — a decision.
What most guides get wrong: Most guides suggest checking stars, forks, and recent commits. That's incomplete. Stars are a weak signal and often misleading — here's a better method. The approach above aligns with the standard checklist but upgrades each step for decisions that actually cost money.
Quick extraction answers for common queries:
To check if a GitHub repo is maintained: A GitHub repository is considered maintained if it has recent commits, regular releases, multiple active contributors, and responsive issue management. More precisely, a repo is maintained if it passes all four checks:
- Last commit within 90 days (by a human, not a bot)
- At least one tagged release within 180 days
- More than one active contributor (no single-person bus factor)
- Issue response time under ~1 week
Passes all four → the repo is maintained. Fails one → caution. Fails two or more → treat as unmaintained.
Is a GitHub repo safe to use? A GitHub repository is considered safe to use when it is actively maintained and has no known vulnerabilities — meaning recent activity, multiple contributors, regular releases, and clean security scans. More precisely, a GitHub repo is safe only if it's actively maintained AND vulnerability-free — and most repos fail one of these in practice.
- Actively maintained — recent activity, distributed contributors (low bus factor risk), recent releases, stable or growing trajectory.
- No known vulnerabilities — verified by a CVE scan (Snyk, Dependabot, or GitHub's security advisory feed).
Maintenance alone isn't safety — a well-maintained project can still ship a vulnerable version. A CVE scan alone isn't safety either — a clean scan on an abandoned project just means no one has reported the bugs yet. Safety requires both conditions simultaneously.
Are GitHub stars a good indicator of repo quality? Stars are useful for discovery, not evaluation. They measure cumulative popularity at some point in the past, not current health, maintenance, or safety.
In this article: What it is · Best way to evaluate a repo · Why stars fail · The 3-tier framework · Activity metrics that matter · Decision intelligence · Alternatives · Best tools · Reduce open-source risk · Worked example · Best practices · Common mistakes · FAQ
Key takeaways:
- Stars are a lifetime counter. They correlate weakly with current health — a 40k-star repo with one active maintainer is more fragile than a 2k-star repo with 30
- Activity metrics (commits, issues, releases) improve on stars but still miss ~40% of real risk signals like bus factor, decay velocity, and trajectory
- Decision intelligence combines 5 composite scores, lifecycle classification, and predictive forecasting — designed to give you a verdict instead of a dashboard
- Auto-partitioning past GitHub's 1,000-result search cap lets you map up to 10,000 repos in a single category scan
- The GitHub Repo Intelligence actor produces decision-intelligence output at $0.15 per repo, roughly 100-1000x cheaper than manual technical diligence
Problems this solves:
- How to evaluate a GitHub repository before adopting it as a dependency
- How to find abandoned GitHub repositories in my tech stack
- How to assess supply-chain risk across hundreds of dependencies
- How to compare competing open-source frameworks with objective scoring
- How to do technical due diligence on a dev-tool startup's public repo
- How to detect repositories that are dying before they break production
Examples table — concepts in action:
| Input scenario | Naive verdict (stars) | Decision-intelligence verdict |
|---|---|---|
| 45k stars, 1 active maintainer, no release in 14 months | "Popular, safe to adopt" | CAUTION, HIGH bus factor risk, COLLAPSING trajectory |
| 2.3k stars, 34 active contributors, weekly releases | "Small, skip it" | STRONGLY_RECOMMENDED, GROWING trajectory |
| 12k stars, commits daily, but all from dependabot | "Looks maintained" | ZOMBIE flag, AT_RISK, no human contributions in 180d |
| 800 stars, dormant for 2 years, 40 new commits this month | "Dead project" | REVIVING trajectory, MEDIUM adoption readiness |
| 60k stars, no CONTRIBUTING.md, no code of conduct, MIT license | "Flagship project" | MEDIUM community score, flagged for governance gaps |
What is GitHub repository evaluation?
Definition (short version): GitHub repository evaluation is a structured assessment framework that scores a public repository across maintenance, adoption, community, supply-chain risk, and outreach signals — producing a decision output (adopt, caution, high-risk) rather than a metrics dashboard.
Repository evaluation is the process of converting a GitHub project's observable public data — commit history, contributor graph, release cadence, community files, license, topics, language distribution, issue activity — into a decision you can act on. There are roughly three categories of evaluation approaches:
- Vanity metrics — stars, forks, watchers. Fast but low signal.
- Activity metrics — commit cadence, issue response time, release frequency, contributor count. Better but still descriptive.
- Decision intelligence — composite scoring, lifecycle classification, predictive forecasting, verdicts. Designed for decisions.
Also known as: open-source due diligence, repository health analysis, dependency risk assessment, OSS adoption evaluation, software supply-chain screening, GitHub project auditing, GitHub repo health check, GitHub repo analysis.
What is the best way to evaluate a GitHub repository?
To evaluate a GitHub repository, check recent activity over the last 90 days, contributor distribution, release cadence, and project trajectory, then use these signals to decide whether to adopt, use with caution, or avoid the project.
The standard way to evaluate a GitHub repo is to check stars, commits, and contributors. That works for quick browsing, but breaks for real decisions because stars don't decay, commit counts don't reflect concentration, and contributor totals don't surface bus-factor risk.
Ignore stars for decisions. A healthy repo shows recent activity, multiple active contributors, regular releases, and a clear trajectory — otherwise treat it as a risk.
The best way to evaluate a GitHub repository is to ignore stars, measure rolling 90-day activity (commits, issues, releases), check contributor concentration for bus-factor risk, assess trajectory direction, and combine those signals into a composite verdict — adopt, caution, or avoid. In short: don't read metrics, decide outcomes.
For quick checks, stars and commits are enough. For real decisions, you need activity, contributor distribution, and trajectory. The rigor you apply should match the stakes.
In practice this is a 3-step progression that maps cleanly to stakes:
- For casual browsing: last-push date + a glance at release history. 30 seconds.
- For standard adoption: 90-day commit cadence + contributor concentration + release discipline + community profile. 5 minutes of manual work per repo, or one API call with a tool.
- For serious stakes (production, due diligence, audit): all of the above plus composite scoring across 5 dimensions (project health, adoption readiness, community, supply-chain risk, outreach), lifecycle classification, and trajectory forecasting. Decision intelligence, not metrics.
The single highest-leverage upgrade most teams can make is moving from "stars + eyeball" to "90-day activity + bus factor." That one change catches the majority of abandoned-but-popular repos. Everything after is incremental rigor for higher-stakes decisions.
Stars Are a Broken Signal for GitHub Evaluation
Stars are useful for discovery, not evaluation. They measure cumulative popularity from the moment the repo was published. They do not decay when a project goes dormant. They do not reflect contributor concentration. They do not tell you whether the license is clear, whether releases are happening, whether the maintainer is responsive, or whether the dependency you're about to pull in has known CVEs.
Research by GitHub's own engineering team and academic work like the CHAOSS project has repeatedly shown that star count is a weak predictor of project health past the initial discovery phase. A 2021 study in the Empirical Software Engineering journal analyzed 2,279 popular GitHub repos and found no statistically significant correlation between star count and bug-fix response time, release cadence, or long-term survival.
Put bluntly: a repo can have 45,000 stars and be one maintainer away from abandonment. It can have 2,000 stars and be one of the healthiest projects in its category. Stars don't know the difference.
The three-tier framework
Evaluation maturity moves through three tiers. Each tier builds on the last, so picking a tier is really about matching rigor to stakes.
Tier 1: Naive (stars and forks)
Eyeballing the star count, glancing at "last commit" date. 30 seconds of effort. Fine for browsing. Not fine for decisions that cost real money.
Tier 2: Intermediate (activity metrics)
Pulling 90-day commits, open issues, release history, contributor list. Where most engineering teams stop. Real improvement over stars, but misses structural signals like contributor concentration and trajectory.
Tier 3: Decision intelligence (composite scoring)
Combining activity metrics, community health, contributor distribution, release discipline, supply-chain flags, and lifecycle classification into a single weighted verdict. Answers "should I adopt / fund / integrate / audit this?" rather than "what's going on?"
What activity metrics actually matter?
Activity metrics that actually predict project survival are commit cadence over rolling 90-day windows, contributor concentration (the bus factor proxy), issue response time, release frequency, and days since last push. Descriptive metrics like raw commit count or total contributors over a project's lifetime are misleading — they don't decay when activity stops.
Here are the activity signals that correlate with project health, based on CHAOSS' health metrics research:
- Commit cadence (90-day rolling) — Weekly commit average over the last 90 days. Drops below 1/week are an early decay signal. This is the same thinking that drives Apify actor reliability monitoring — rolling windows beat lifetime counters for catching drift.
- Contributor concentration — Share of commits by the top contributor. Above 80% means one person's departure kills the project.
- Signed commit ratio — Percentage of commits cryptographically signed. Low ratio is a supply-chain flag.
- Issue response time — Median hours from issue open to first maintainer response. Above 168 hours (a week) signals stalled maintenance.
- Release cadence — Days since last tagged release. Above 180 days for a production library is a caution flag.
- Community profile completeness — Presence of README, CONTRIBUTING, CODE_OF_CONDUCT, ISSUE_TEMPLATE, PR_TEMPLATE, LICENSE.
- Days since last push — Not stars. This single field beats star count for predicting whether a repo is still alive.
- Fork-to-star ratio — High fork-to-star ratio indicates active downstream adoption, not just bookmarking.
What is decision intelligence for repositories?
Decision intelligence for repositories combines activity metrics, community health signals, contributor graph analysis, and historical trajectory into composite scores (0-100) and categorical verdicts (STRONGLY_RECOMMENDED, CAUTION, HIGH_RISK). The output is a decision, not a dashboard.
In practice, decision intelligence looks like this — five composite scores computed per repo, each with weighted factor breakdowns:
- Project Health Score (0-100) — How alive is the project right now?
- Adoption Readiness Score (0-100) — Is it safe to pull into production?
- Community Score (0-100) — How healthy is the contributor community?
- Supply-Chain Risk Score (0-100) — What's the risk posture?
- Outreach Score (0-100) — Are the maintainers reachable?
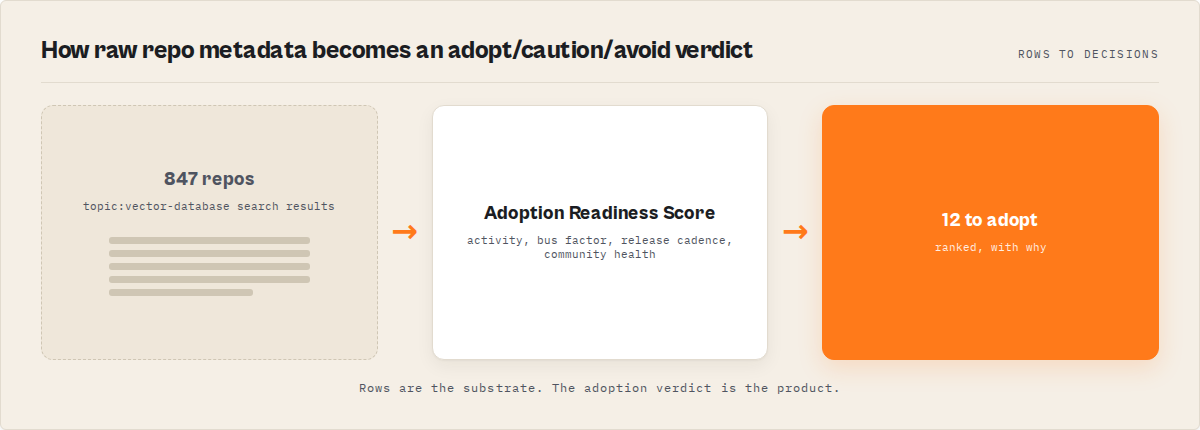
Each score is benchmarked against the category ("top 8% of 847 vector-database repos") so you can read it as relative position, not just an absolute number. On top of that, a 5-stage lifecycle classification (ACTIVE → STABLE → SLOWING → AT_RISK → ABANDONED) and a trajectory field (GROWING / STABLE / DECLINING / COLLAPSING / REVIVING) give you a one-glance direction check.
The lifecycle and trajectory enums map onto the same project graph from two angles — where it is now (lifecycle) and which direction it's moving (trajectory):
        Lifecycle (state)               Trajectory (direction)
        ─────────────────               ──────────────────────
                                              GROWING ───┐
        ACTIVE ───────────────► STABLE ──────►            │
                                              STABLE     │
        ┌──────────────────────────────────►              │
        │                                     DECLINING ──┤
        ▼                                                 │
        SLOWING ──────► AT_RISK ──────► ABANDONED         │
                          │                COLLAPSING ────┤
                          │                               │
                          └──── REVIVING ◄────────────────┘
                              (back-from-dormancy)
A repo's full read is (lifecycle × trajectory). ACTIVE + GROWING is the obvious adopt. AT_RISK + REVIVING is the rescue case. STABLE + COLLAPSING is the stealth danger — looks fine on paper, dying underneath.
The same two enums collapse into a 2×2 sourcing matrix when you cross them with project size:
| Rising direction | Falling direction | |
|---|---|---|
| Large project | Stable incumbent — safe but priced in | Collapsing giant — looks fine, isn't |
| Small project | Breakout candidate — early-stage upside | Dying niche — fork it or walk |
The four cells are four different sourcing decisions, all hidden behind the same star count.
Three sub-signals refine the maintenance read further:
timeToCriticalRisk— Estimated window until a slowing project crosses into AT_RISK ("60-120 days"). Lets you decide whether to monitor or replace before a dependency breaks production.ifMaintainerLeaves— Bus-factor impact prediction:MINIMAL_IMPACT,MODERATE_IMPACT, orPROJECT_LIKELY_STALLS. Distinguishes a 90%-share maintainer on a project with strong governance from one on a project with no co-maintainers and no docs.- Feature-complete detection — Some repos look dormant because they're done, not dying. A small, finished utility with no commits in 18 months but a stable test suite, a clean license, and zero open issues is feature-complete, not abandoned. Treating those two as the same is one of the fastest ways to make bad adoption calls.
JSON output example
Here's what decision-intelligence output looks like for a single repo:
{
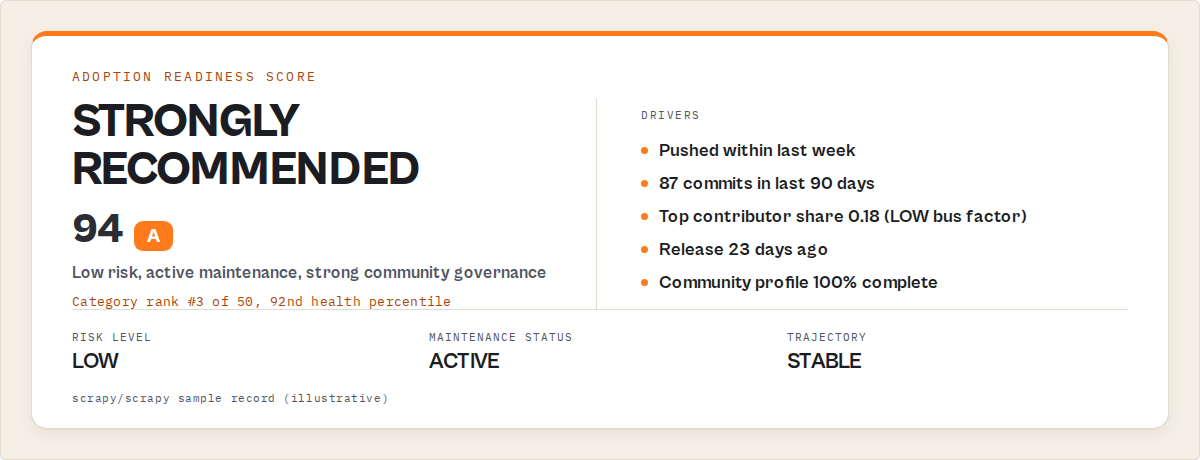
"fullName": "scrapy/scrapy",
"stars": 53200,
"daysSinceLastPush": 4,
"scores": {
"projectHealthScore": 91,
"adoptionReadinessScore": 94,
"communityScore": 88,
"supplyChainRiskScore": 8,
"outreachScore": 62
},
"benchmarks": {
"categoryRank": 3,
"totalInCategory": 50,
"healthPercentile": 92
},
"recommendations": {
"adoptionVerdict": "STRONGLY_RECOMMENDED",
"riskLevel": "LOW",
"maintenanceStatus": "ACTIVE"
},
"maintenance": {
"trajectory": "STABLE",
"decayScore": 3,
"busFactorRisk": "LOW",
"ifMaintainerLeaves": "MINIMAL_IMPACT",
"timeToCriticalRisk": null
},
"forecast": {
"growthProjection30d": "HIGH",
"abandonmentRisk90d": "LOW"
}
}
That's the raw material for a decision. Notice what's not there: raw commit counts, star-velocity chart screenshots, "last month's numbers." The output is already scored, ranked, and verdict-tagged.
What you get back per run
Per-repo scoring is half the output. The other half is a run-level summary in the key-value store, designed to be paste-ready for Slack, reports, or dashboards without further processing:
- Leaderboards — Top 10 by each of the 5 scores, so a category scan returns five ranked lists (most adoptable, lowest risk, most reachable maintainers, etc.) instead of one undifferentiated table.
- Ranking explanations for the top 3 — Plain-English "why this beat #2" notes so the leaderboard isn't a black box. ("vuejs/vue ranks above sveltejs/svelte on adoption readiness because community profile is 100% complete vs 67%, latest release is 11 days vs 84 days, and signed commit ratio is 0.91 vs 0.42.")
- Category market intelligence — Score distributions across the category, count of declining/abandoned signals, breakout detection (repos with star velocity in the top 1% of category) — so a market-map run tells you the shape of the category, not just the leaders.
- Narrative summary — A short paragraph synthesising the run ("Of 847 vector-database repos scanned, 62 are STRONGLY_RECOMMENDED, 14 newly abandoned, 3 breakout candidates this week"). Drops directly into a stand-up or weekly digest.
- Query coverage report — How many partitions were scanned, how many duplicates deduped, and a confidence level for whether the auto-partition strategy actually swept the full category. Avoids the "we scanned 1,000 repos and assumed that was the whole market" failure mode.
- Diff summary (when
compareToPreviousRunis on) — Counts of NEW, SCORE_CHANGE, STATUS_CHANGE, and NEWLY_ABANDONED repos since the previous scheduled run, with the affected repo names listed.
The per-repo dataset is the audit trail. The KV summary is the executive read.
What are the alternatives to repository evaluation frameworks?
There are roughly five approaches for evaluating GitHub repositories. Each makes different tradeoffs between effort, cost, and decision quality.
- Eyeball the GitHub page — Zero cost, zero rigor. Appropriate for discovery, not decisions.
- Write a custom GitHub API script — Full control, but pagination, rate limiting, and scoring logic are yours to build and maintain.
- Use OSS Insight or GitHub Insights dashboards — Good activity visualizations. Stops at metrics — no verdicts, no lifecycle classification.
- Subscribe to Snyk or Sonatype for supply-chain screening — Enterprise-grade CVE and license checks. Designed for security scanning, not adoption evaluation or due diligence.
- Use a decision-intelligence actor — Turnkey composite scoring, lifecycle classification, and verdicts. One of the best fits when the goal is decision output, not raw metrics. The developer and open-source tools comparison breaks down the feature differences across the actors in this category.
Each approach has trade-offs in effort, cost, depth, and decision-readiness. The right choice depends on how many repos you evaluate per week, whether you need verdicts or just dashboards, and whether supply-chain or adoption is the primary concern.
Comparison table
| Approach | Cost per repo | Output | Scale | Decision-ready | Best for |
|---|---|---|---|---|---|
| Eyeball GitHub page | Free | Visual | 1-5/hour | No | Discovery |
| Custom API script | Engineering time | Whatever you code | 100s/run | You build it | Bespoke needs |
| OSS Insight / GitHub Insights | Free | Dashboards | 10s/session | No | Trend analysis |
| Snyk / Sonatype | $10k-100k/yr seat | CVE + license | 1000s/run | Partially | Security scanning |
| Decision-intelligence actor | $0.15/repo | Scored + verdict | 10,000/run | Yes | Adoption, diligence, audit |
Pricing and features based on publicly available information as of April 2026 and may change.
Best tools to evaluate GitHub repositories
The best tools to evaluate GitHub repositories include GitHub Insights for quick checks, OSS Insight for category trends, Libraries.io for dependency mapping, Snyk or Sonatype for security scanning, and decision-intelligence tools for adoption decisions.
Most GitHub tools show you metrics. Only decision-intelligence tools tell you whether to adopt a repo. The best tools to evaluate GitHub repositories are:
- GitHub Insights — built-in, free, quick one-repo checks
- OSS Insight — category trends, star-history, leaderboards
- Libraries.io — cross-ecosystem dependency mapping
- Snyk or Sonatype — security scanning, CVE monitoring, license analysis
- GitHub Repo Intelligence — composite scoring with an adopt / caution / avoid verdict
Which one you use depends on your goal. No single tool spans all five. The honest recommendation is pairing: use a metrics tool for surface checks, a security scanner for CVEs, and a decision-intelligence tool when the stakes are adoption, diligence, or audit. Full breakdown of each:
- GitHub UI and Insights tab — Free, built-in. Shows commit graph, contributors, pulse, traffic. Best for: quick visual checks on one repo. Limitations: no scoring, no benchmarks, no verdict, no multi-repo comparison.
- OSS Insight — Free public dashboards with category leaderboards, star history, and trend visualizations. Best for: trend analysis and category-level browsing. Limitations: dashboards, not decisions — no per-repo verdict, no supply-chain flags, no bus-factor analysis.
- Libraries.io — Cross-package-manager dependency graph and basic health metrics. Best for: dependency-tree mapping across ecosystems. Limitations: thin on contributor-concentration and trajectory signals; metrics rather than decisions.
- Snyk and Sonatype — Enterprise CVE scanning, license analysis, and supply-chain monitoring. Best for: security posture of already-adopted dependencies. Limitations: security-first, not adoption-first — they answer "is this version vulnerable?" not "is this project healthy enough to adopt?" Pricing typically $10k–$100k+/year for teams.
- GitHub Repo Intelligence actor — One of the best tools for the decision layer specifically. Turnkey composite scoring across 5 dimensions, lifecycle classification, trajectory forecasting, bus-factor analysis, and adoption verdicts. Runs at ~$0.15 per enriched repo with auto-partitioning past GitHub's 1,000-result cap. See the developer and open-source tools comparison for side-by-side feature details.
Tools comparison table
| Tool | Layer | Output | Category scans | Decision-ready | Best for |
|---|---|---|---|---|---|
| GitHub UI / Insights | Visual | Charts | No | No | One-repo glance |
| OSS Insight | Metrics | Dashboards | Limited | No | Category trends |
| Libraries.io | Dependency graph | Metadata | Partial | No | Cross-ecosystem mapping |
| Snyk / Sonatype | Security | CVE + license | Yes | Partially | Post-adoption monitoring |
| GitHub Repo Intelligence | Decision | Scored + verdict | Yes (10,000+ repos) | Yes | Adoption, diligence, audit |
Tool positioning based on publicly available information as of April 2026 and may change.
The short version: if you only need to glance at one repo, use GitHub's Insights tab. If you need to compare a shortlist, use OSS Insight or Libraries.io. If you're auditing a dependency tree for vulnerabilities, use Snyk or Sonatype. If you need an actual verdict — adopt, caution, or avoid — across tens or thousands of repos, you want a decision-intelligence tool.
How to reduce risk when using open-source dependencies
To reduce open-source risk, evaluate repository health before adoption, scan for known vulnerabilities, monitor maintainer activity, and regularly re-evaluate dependencies to detect projects that become unmaintained.
Vulnerability scans catch known issues. The bigger risk is dependencies that silently die without warning. Most guidance on reducing open-source risk focuses on vulnerability scanning — that's necessary but only catches known issues in specific versions. Abandoned projects don't patch CVEs, don't fix bugs, and don't respond to issues, which means yesterday's clean scan becomes tomorrow's unreported vulnerability.
To reduce risk when using open-source dependencies, combine four practices: evaluate repo health before adoption, scan for known vulnerabilities continuously, monitor for maintainer dropout, and review license compatibility. Each addresses a distinct failure mode — adoption-time mistakes, version-level CVEs, post-adoption abandonment, and legal exposure.
Map each risk to the signal that catches it:
- Abandonment risk → Check trajectory (GROWING / STABLE / DECLINING / COLLAPSING / REVIVING),
daysSinceLastPush, andmaintenance.status. Abandoned projects don't patch CVEs, don't fix bugs, don't respond to issues. - Bus factor risk → Measure contributor concentration. A top contributor share above 80% means one person's departure stalls the project. Distributed contributor graphs are resilient; concentrated ones aren't.
- Zombie-activity risk → Separate human commits from bot commits. A repo with daily activity from
dependabot[bot]andgithub-actions[bot]but zero human-authored commits in 90 days is being kept alive, not maintained. - CVE risk → Use Snyk, Dependabot, or GitHub's security advisory feed. Repo-health tools do not replace version-level vulnerability scanning — they answer different questions.
- License risk → Check that a LICENSE file exists, parses cleanly, and matches your project's requirements. MIT and Apache-2.0 are permissive; GPL-family licenses may conflict with commercial use. Missing or ambiguous licenses are a legal flag, not a green light.
- Supply-chain risk → Look at signed commit ratio, release discipline, and governance files (CONTRIBUTING, CODE_OF_CONDUCT). Projects with no release cadence and unsigned commits are higher-risk injection surfaces.
- Re-evaluation cadence → A one-time audit decays within 90 days. Schedule monthly (or weekly for fast-moving categories) re-runs with change detection so newly abandoned projects surface before they break production.
The single most important habit: don't evaluate once and forget. Projects that were healthy at adoption-time can silently become unmaintained. The teams that avoid supply-chain surprises are the ones running scheduled re-evaluation, not the ones running rigorous one-off audits.
Best practices for GitHub repository evaluation
- Match rigor to stakes. Casually evaluating a library for a side project? Eyeball it. Evaluating a dependency that will ship in a production SaaS platform used by thousands of customers? Tier 3 is the floor.
- Never rely on a single signal. Stars alone are useless. Commits alone are gameable (see zombie repos). Trajectory + bus factor + community score together are much harder to fake.
- Benchmark against the category, not the index. A repo with 2k stars could be #1 in its niche. A repo with 15k stars could be mid-pack in a crowded category. Category percentile matters more than absolute numbers.
- Check trajectory, not just status. A project classified ACTIVE but with a COLLAPSING trajectory is at higher risk than a project classified SLOWING but with a REVIVING trajectory. Status is now. Trajectory is direction.
- Audit bus factor separately. Even a healthy-looking project can have one contributor doing 90% of the commits. That's a single-point-of-failure you need to price in before adopting.
- Schedule re-evaluations. A one-time audit becomes stale within 90 days. Weekly or monthly scheduled runs with change detection catch new abandonments before they bite.
- Cross-reference with CVE databases. Repository health ≠ security posture. Pair adoption evaluation with a CVE scan for dependencies going into production.
- Separate popularity from health. Treat stars as a marketing signal, not a health signal. They tell you about discovery, not maintenance.
Common mistakes when evaluating GitHub repositories
- Mistake 1: Treating "last commit today" as a green light. Dependabot PRs and GitHub Actions bot commits show up as recent activity but aren't real maintenance. This is the zombie-repo pattern. Look at human-authored commits specifically.
- Mistake 2: Ignoring contributor concentration. A repo with 547 lifetime contributors but where the top one accounts for 90% of commits in the last 12 months is effectively a single-maintainer project. Bus factor risk is concentrated, not distributed.
- Mistake 3: Using stars to compare across categories. 3k stars is huge in vector databases, mid-pack in JavaScript web frameworks, and tiny in "awesome-X" list repos. Category-relative benchmarks matter.
- Mistake 4: Skipping release discipline. A repo with fresh commits but no tagged release in 18 months is not production-ready. Commits are work-in-progress. Releases are contracts.
- Mistake 5: Assuming license presence means license clarity. A LICENSE file with
TODOor a copy-pasted MIT header with someone else's name is a flag, not a pass. - Mistake 6: Evaluating once and never again. Projects abandon themselves. Maintenance flags that were green six months ago can be red today. One-time evaluation is technical debt.
A worked example: flipping naive judgments
Let me walk through two real-ish archetypes where the naive judgment flips once you apply the decision-intelligence framework.
Archetype A: The 45k-star dormant giant
A popular Python utility library has 45,000 stars, 6,200 forks, was featured on the GitHub trending page three years ago. The README is slick.
Naive verdict: "Obviously safe. 45k people can't all be wrong."
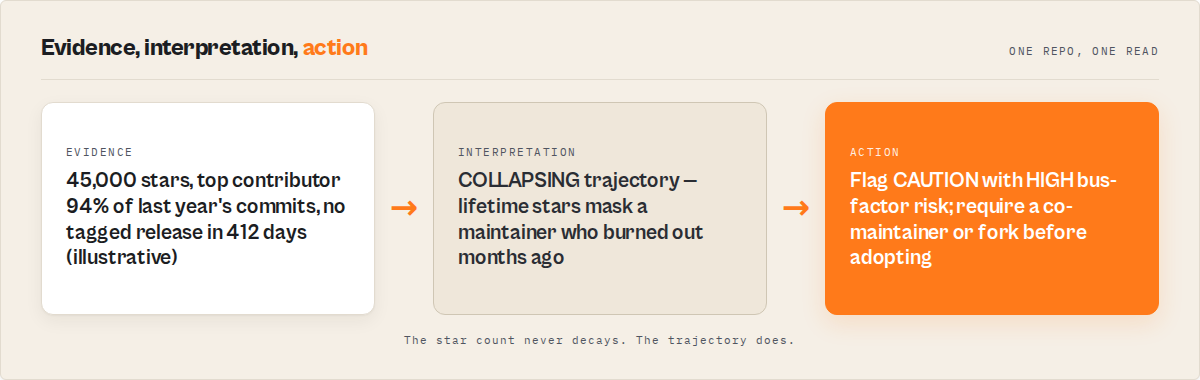
Decision-intelligence verdict: maintenance.trajectory returns COLLAPSING. daysSinceLastPush is 127. contributors.topContributorShare is 0.94 — one person wrote 94% of the commits in the last year. latestRelease.daysSinceRelease is 412 days. Supply-chain risk score is 67/100. The verdict: CAUTION, HIGH bus factor risk, NEWLY_ABANDONED flag triggered last week. The 45,000 stars are a lifetime counter; they don't tell you the sole maintainer burned out 4 months ago.
Archetype B: The 2k-star sleeper
A vector-database-adjacent tool has 2,300 stars, 180 forks. You've never heard of it.
Naive verdict: "Small, skip it."
Decision-intelligence verdict: trajectory: GROWING. 284 commits in last 90d. Top contributor share is 0.23 — distributed across 34 active contributors. Community profile 100% complete. Signed commit ratio 0.89. Latest release 11 days ago. Benchmarks: top 6% of 847 vector-database repos. Verdict: STRONGLY_RECOMMENDED, GROWING, LOW supply-chain risk. The naive judgment flipped.
Archetype C: The "looks maintained" zombie
A repo with 12,000 stars, commits every day. Looks alive.
Decision-intelligence verdict: isZombie: true. Every commit in the last 90 days was authored by dependabot[bot] or github-actions[bot]. Zero human commits, zero PR reviews, zero releases. zombieSignals: bot_only_commits, no_human_activity_90d, no_releases_180d. Verdict: AT_RISK, HIGH supply-chain risk. Bots create the illusion of activity without the substance of maintenance.
Mini case study — category audit in a single run
A hypothetical engineering team at a mid-size AI company needed to pick an open-source vector database to standardize on. Their initial shortlist was based on — you guessed it — stars. Top 5 candidates, 8k to 45k stars each.
Before: Two engineers spent 3 weeks manually reading repos, filing spreadsheets, comparing commits. Final shortlist still depended heavily on subjective impressions.
After: They ran the GitHub Repo Intelligence actor with mode: "market-map" and query: "topic:vector-database" with autoPartitionResults: true. The actor mapped 847 repos in the category in ~4 minutes, scored each on 5 dimensions, and returned a ranked shortlist with per-repo verdicts. Total cost: $127 for 847 enriched repos.
Result: The category audit that took 3 engineer-weeks ($18,000+ at loaded rates) ran in minutes for ~$127. Two of the top-5-by-stars candidates dropped out — one flagged ZOMBIE, one flagged COLLAPSING. The eventual pick was a #8-by-stars repo that ranked #1 by adoption readiness.
These numbers reflect one internal scenario. Results vary depending on category size, team rates, and how rigorous the manual alternative is.
Implementation checklist
To run decision-intelligence evaluation on a repo or category:
- Define scope. One repo (due diligence) or a whole category (market map, dependency audit)?
- Pick a solution mode.
adoption-shortlistfor new dependencies,dependency-auditfor supply-chain,repo-due-diligencefor VC diligence,market-mapfor category scans. - Get a free GitHub token. No scopes needed. Triples throughput. Create at github.com/settings/tokens.
- Configure the input. Query, filters, max results, token. Enable
autoPartitionResultsfor categories past 1,000 repos. - Run and retrieve. JSON, CSV, or Excel. Parse the
recommendationsobject for verdicts,scoresfor dimensional breakdown. - Schedule re-runs. Enable
compareToPreviousRunto catch newly abandoned repos between runs. - Cross-reference verdicts with CVE data. Decision intelligence answers "is this project healthy?" — it doesn't replace CVE scanning for production-bound dependencies.
Example input JSON
{
  "query": "topic:vector-database",
  "mode": "adoption-shortlist",
  "minStars": 100,
  "maxResults": 200,
  "autoPartitionResults": true,
  "excludeForks": true,
  "excludeArchived": true,
  "githubToken": "ghp_xxxxxxxxxxxxxxxxxxxxxxxxxxxxxxxxxxxx"
}
That input pulls up to 200 vector-database repos with at least 100 stars, skips forks and archived projects, enriches each with community and activity data, scores them on all 5 dimensions, and returns them sorted by adoption readiness.
Limitations
- Search index lag. GitHub's Search API doesn't instantly reflect new repos or updated star counts. Brand-new projects may be invisible for minutes to hours.
- 1,000-result hard cap per query segment. GitHub's Search API limits each query to 1,000 results. Auto-partitioning breaks past this by splitting star ranges, but very broad queries (e.g.,
language:python) still need thoughtful segmentation. - No private repo access. Only public repositories are evaluated. Private repos need different tooling and explicit token scopes.
- Email extraction varies by repo. Many contributors use GitHub noreply addresses. Expected hit rates are 20-60% depending on project culture.
- Predictive forecasts are probabilistic.
abandonmentRisk90d: "LOW"is not a guarantee. It's a weighted classification based on current signals. Projects can change trajectory fast.
Key facts about GitHub repository evaluation
- Star count has no statistically significant correlation with bug-fix response time, release cadence, or long-term survival past the initial discovery phase.
- Two in three open-source projects that application developers depend on have become dormant, per Sonatype's 2024 report.
- 84% of commercial codebases audited by Synopsys in 2024 contained at least one open-source component with a known vulnerability.
- GitHub's Search API has a hard 1,000-result limit per query, requiring partitioning strategies for category-wide scans.
- Top-contributor share above 80% of recent commits indicates concentrated bus factor risk — a single person's departure can stall the project.
- A repo can have 45,000 lifetime stars and be classified COLLAPSING with HIGH abandonment risk simultaneously. Stars and health are independent variables.
- Unauthenticated GitHub API access is limited to 10 requests/minute; token-authenticated access is 30/minute — a 3x throughput gain at zero cost.
- Decision-intelligence evaluation at $0.15 per repo is roughly 100-1000x cheaper than manual technical diligence at engineering loaded rates.
Short glossary
- Bus factor — The number of contributors who could be "hit by a bus" before the project stalls. Low bus factor means high single-point-of-failure risk.
- Zombie repo — A project showing activity signals (recent commits) that are driven by bots or automated tooling rather than human maintenance.
- Trajectory — The directional classification of a project's activity over time: GROWING, STABLE, DECLINING, COLLAPSING, or REVIVING.
- Decay score — A 0-100 measure of how fast a project is losing activity, with an associated velocity (NONE, SLOW, FAST).
- Adoption verdict — A categorical recommendation output (STRONGLY_RECOMMENDED, RECOMMENDED, CAUTION, HIGH_RISK) based on composite health, risk, and community signals.
- Supply-chain risk score — A 0-100 score flagging license ambiguity, abandonment, single-maintainer status, unsigned commits, and stale releases.
Broader applicability
The evaluation pattern here — moving from vanity metrics to activity metrics to decision intelligence — applies far beyond GitHub. The same progression shows up in B2B lead scoring (impressions → engagement → ICP-match verdict), corporate due diligence (headcount → financials → composite risk score), and actor reliability monitoring (success rate → schema conformance → fleet health verdict, which is covered in the Apify actor reliability post).
Five universal principles apply:
- Convert signals into decisions, not dashboards.
- Benchmark against a reference population, not absolute numbers.
- Separate direction (trajectory) from status (current state).
- Weight signals by what predicts future outcomes, not what's easy to measure.
- Re-evaluate on a schedule — one-time audits decay fast.
When you need this
Use decision-intelligence evaluation when:
- Adopting an open-source dependency that will run in production
- Doing technical due diligence on a dev-tool startup's public repo before investing
- Auditing an existing dependency tree for supply-chain risk
- Mapping a technology category for competitive intelligence
- Comparing two or more frameworks side-by-side for a standardization decision
- Sourcing reachable maintainers for outreach or partnerships
You probably don't need this if:
- You're picking a library for a throwaway weekend prototype
- You already have deep internal context on the project (e.g., your team wrote it)
- You just need a yes/no CVE scan — use Snyk or Dependabot
- The repo is private and not reachable via GitHub's public APIs
- You're evaluating code quality specifically (that needs static analysis, not metadata)
How to evaluate a GitHub repository for adoption
Use decision-intelligence mode adoption-shortlist. The output includes an adoptionReadinessScore (0-100), a categorical verdict (STRONGLY_RECOMMENDED, RECOMMENDED, CAUTION, HIGH_RISK), and a per-factor breakdown covering license, maintenance, release recency, community health, and contributor diversity. Read the verdict first, the score second, the factor breakdown third.
How to check if a GitHub project is still maintained
Check three fields together: daysSinceLastPush, maintenance.trajectory, and isZombie. A project with fresh pushes but an isZombie: true flag is being kept alive by bots, not maintainers. A project with no pushes in 180+ days and trajectory: "COLLAPSING" is effectively abandoned even if it's not formally flagged yet. Decision-intelligence output resolves this ambiguity with a single maintenance.status field: ACTIVE, STABLE, SLOWING, AT_RISK, or ABANDONED.
How to compare two GitHub repositories side by side
Use the compare mode with a compareRepos array like ["facebook/react", "vuejs/vue", "sveltejs/svelte"]. The actor fetches each directly, scores them across 5 dimensions, picks a winner with explanation, and returns a comparison table. This is more useful than raw star counts because it accounts for trajectory, bus factor, community health, and supply-chain posture together rather than comparing single metrics in isolation.
Common misconceptions
"A repo with lots of stars is safe to depend on." Stars measure cumulative popularity, not current health. A 45,000-star repo can be classified COLLAPSING with HIGH bus factor risk at the same time.
"Recent commits mean the project is maintained." Recent commits from dependabot[bot] or github-actions[bot] are not maintenance — they're automation. This is the zombie-repo pattern. Look at human-authored commits in the last 90 days specifically.
"One audit is enough." Projects change trajectory fast. A green audit from 90 days ago can be red today. Schedule re-evaluations with change detection or expect to be surprised by abandonments.
"Open-source due diligence requires a security consultant." For adoption decisions, composite scoring with lifecycle classification is typically sufficient. Security consultants are still the right call for CVE audits and code-level review, but that's a different question from "is this project healthy enough to adopt?"
"All GitHub activity metrics say the same thing." They don't. Stars measure discovery. Commits measure work. Releases measure shipping. Issues measure demand. Contributors measure resilience. Different dimensions answer different questions — collapsing them into one metric loses information.
Frequently asked questions
Why are GitHub stars a bad signal for evaluating repositories?
Stars are a lifetime counter that never decays. A project can accumulate 40,000 stars during a viral moment three years ago and then go dormant, but the star count remains. Academic research and GitHub's own engineering writing consistently find that star count correlates weakly with current project health. For adoption decisions, you want signals that decay when activity stops — commits in last 90 days, days since last push, contributor share — not cumulative popularity.
How do I detect abandoned GitHub repositories at scale?
Run a category-wide scan with auto-partitioning enabled, then filter on isAbandoned: true (no push in 365+ days) and maintenance.status: "ABANDONED". For softer signals, filter on maintenance.trajectory: "COLLAPSING" — projects that are on the path to abandonment but haven't crossed the 365-day threshold yet. This catches dying projects before they formally die, which is when the information is actually actionable.
What's the difference between activity metrics and decision intelligence?
Activity metrics describe what's happening in a repo: "87 commits in the last 90 days, 547 contributors, latest release 23 days ago." Decision intelligence converts those metrics into a verdict: "STRONGLY_RECOMMENDED, LOW risk, GROWING trajectory, top 8% of 847 category repos." The first is a dashboard. The second is a decision. For engineering leads, VCs, and security auditors, the second is what the work actually needs.
Can I evaluate private or internal GitHub repositories?
Public-repo evaluation tools use GitHub's public Search API, which does not return private repos. For private-repo evaluation you need a different approach — GitHub's GraphQL API with authenticated scopes, your own CI/CD metrics, or self-hosted analytics tools. The frameworks described in this post apply to either, but the tooling differs.
How much does decision-intelligence evaluation cost versus manual diligence?
At $0.15 per repo, a 200-repo category scan runs $30. A single-repo deep due diligence run is $0.15. Manual evaluation by an engineer at loaded rates ($150-250/hr) costs roughly $50-200 per repo depending on depth. For category-wide scans at 200+ repos, that's a 100-1000x cost delta. For one-off evaluations of a critical dependency, manual review is still cheap enough to combine with automated scoring — use both.
How often should I re-evaluate my dependency tree?
Monthly at minimum for production dependencies, weekly for anything in a fast-moving category like AI tooling or cryptography. Projects abandon themselves faster than engineering teams expect. Sonatype's 2024 report found that 2 of 3 OSS projects commercial teams depend on had become dormant. Cross-run change detection (flagging NEW, SCORE_CHANGE, STATUS_CHANGE, NEWLY_ABANDONED) is what makes scheduled re-evaluation actionable instead of noisy.
Does decision-intelligence evaluation replace CVE scanning?
No. They answer different questions. Decision intelligence answers "is this project healthy enough to adopt, fund, or integrate?" CVE scanning answers "does this specific version contain a known vulnerability?" Tools like Snyk, Dependabot, and GitHub's own security advisory feed handle the CVE question. Use both together — one to decide whether to adopt, the other to monitor what you've already adopted.
Can I use this for VC technical diligence on dev-tool startups?
Yes, and it's one of the use cases the repo-due-diligence mode is designed for. Full enrichment (community, activity, contributors, releases, emails) plus composite scoring gives VC associates a quantitative backbone for what's usually a subjective call. It doesn't replace technical reference checks with founders and early users — but it catches pattern signals (bus factor, trajectory, supply-chain posture) that founders typically don't volunteer.
Ryan Clinton publishes Apify actors as ryanclinton and builds developer tools at ApifyForge.
Last updated: May 2026
This guide focuses on GitHub repositories, but the same evaluation patterns — moving from vanity metrics to activity signals to decision intelligence — apply broadly to any public-data assessment problem, from B2B lead scoring to corporate due diligence to portfolio-wide actor reliability monitoring. For a worked-through example applying the same activity-decay and bus-factor signals across a named cohort, see the OSS Maintainer Burnout Index 2026 — a public-data audit of maintainer-cohort dormancy across the most-depended-on packages on GitHub.