Fleet Health Report — Consolidated Fleet Intelligence is an Apify actor on ApifyForge. Prioritize your whole portfolio. This actor tells you exactly how to grow your Apify revenue and which actor to act on first. It costs $1.00 per fleet-analyzed. Best for investigators, analysts, and risk teams conducting due diligence, regulatory tracking, or OSINT research. Not ideal for real-time surveillance or replacing classified intelligence systems. Maintenance pulse: 90/100. Last verified March 27, 2026. Built by Ryan Clinton (ryanclinton on Apify).
Fleet Health Report — Consolidated Fleet Intelligence
Fleet Health Report — Consolidated Fleet Intelligence is an Apify actor available on ApifyForge at $1.00 per fleet-analyzed. Prioritize your whole portfolio. This actor tells you exactly how to grow your Apify revenue and which actor to act on first.
Best for investigators, analysts, and risk teams conducting due diligence, regulatory tracking, or OSINT research.
Not ideal for real-time surveillance or replacing classified intelligence systems.
What to know
- Limited to publicly available and open-source information.
- Report depth depends on the availability of upstream government and public data sources.
- Requires an Apify account — free tier available with limited monthly usage.
Maintenance Pulse
90/100Cost Estimate
How many results do you need?
Pricing
Pay Per Event model. You only pay for what you use.
| Event | Description | Price |
|---|---|---|
| fleet-analyzed | Charged per fleet analysis. Aggregates stats, trends, and forecasting across your actor portfolio. | $1.00 |
Example: 100 events = $100.00 · 1,000 events = $1000.00
Documentation
Prioritize your whole portfolio. This actor tells you exactly how to grow your Apify revenue and which actor to act on first.
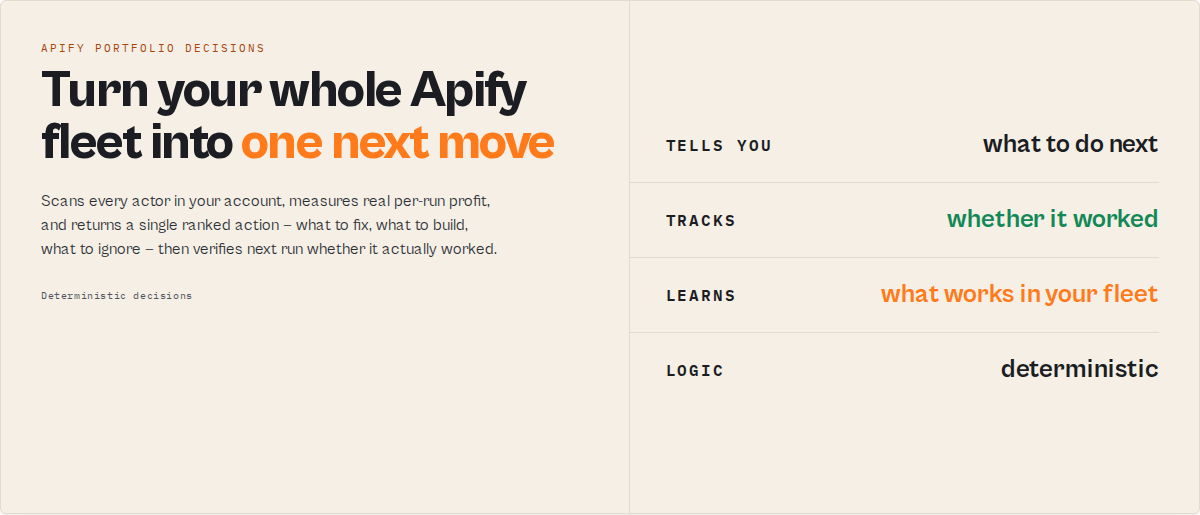
It is the daily operating brief for Apify developers running multiple monetized actors: it tells you what to fix, what to ignore, and whether last week's action actually worked.
Fleet Health Report is the portfolio-level decision stage in an Apify actor execution lifecycle — it turns the state of every actor in your account into a single next best action.
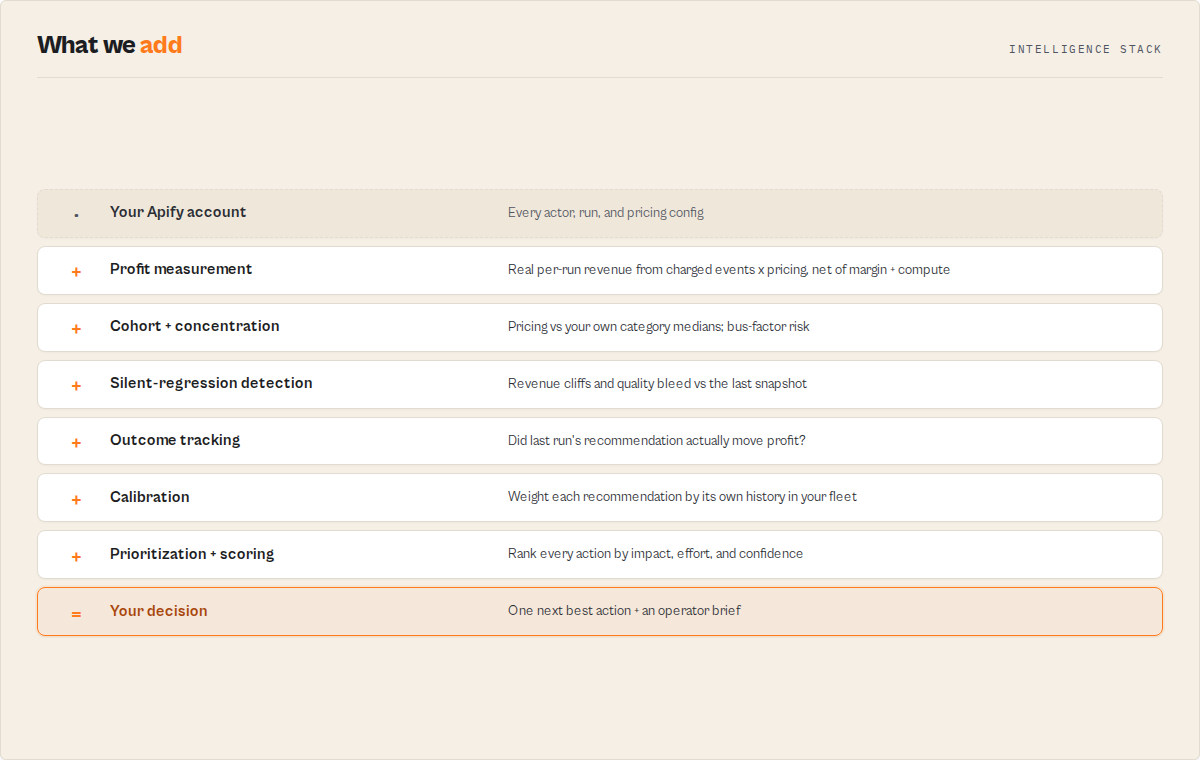
Scans every actor in your account, measures real per-run profit (not guessed), detects revenue cliffs and silent quality bleed before they trip normal fail-rate alerts, benchmarks your pricing against your own category cohorts, and returns a prioritized action queue with a single "next best action" you can work from. One API call. Works whether you run 5 actors or 500.
Open the run, read one field, do one thing. That loop is the product.
What every run gives you:
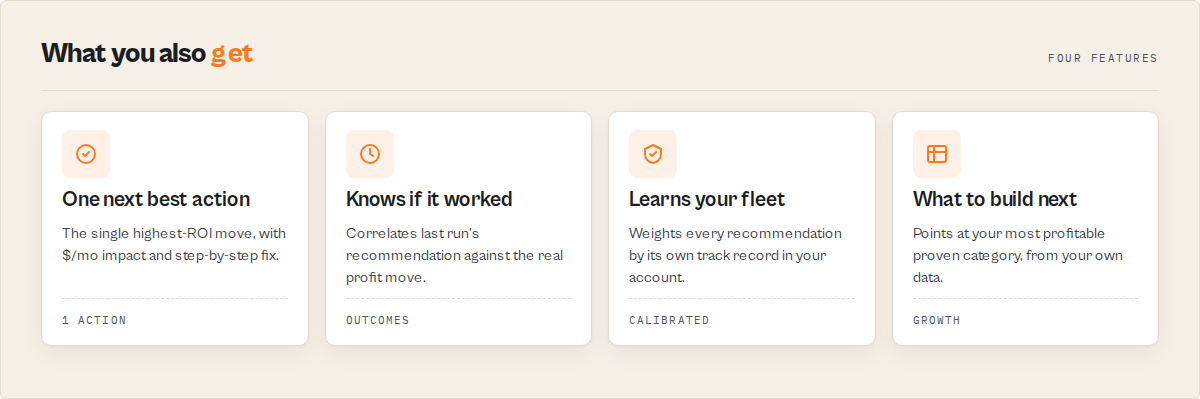
- Finds your highest-ROI action — the single
nextBestAction, with estimated$/moimpact and step-by-step fix instructions. - Tracks whether it worked —
outcomeTrackingcorrelates last run's recommendation against the actual profit move on the targeted actor. - Learns what works in your fleet —
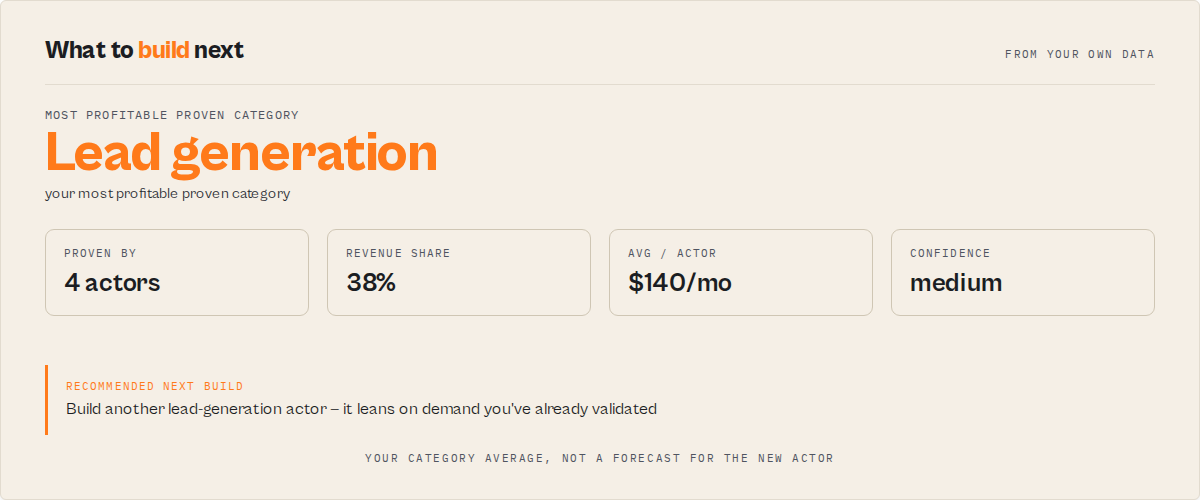
calibrationweights every future recommendation by its own historical accuracy in your portfolio. - Tells you what to build next —
buildRecommendationpoints at the most profitable category you've already proven.
Most analytics tools tell you what to do. This one tells you whether it worked — and learns from it. That persistent memory is also why this beats pasting your metrics into ChatGPT: a chat has no record of which of your past changes actually paid off, and no benchmark of which action types reliably work in your fleet. This run does, because it reads its own prior runs.
Ready-to-run examples
One-click published tasks — each runs against your own Apify account:
- What should I fix first in my actors? — the single highest-impact fix to make first.
- Find underpriced actors & lost revenue — per-actor profit and underpriced actors vs their category cohort.
- What actor should you build next? — your most profitable proven category and what to build next.
- Actor portfolio health check — one 0-100 score across reliability, cost, quality, compliance, and revenue.
Mental model
This is a daily decision loop for your Apify business: analyze → pick one action → apply → measure → learn → repeat. Every feature in the output exists to make one of those six steps easier.
  Analyze fleet
        │
        ▼
  Choose one action   ← operatorBrief / nextBestAction (the one field you read)
        │
        ▼
   Apply the fix
        │
        ▼
  Measure result      ← outcomeTracking (did it actually move profit?)
        │
        ▼
      Learn           ← calibration (weight what works in YOUR fleet)
        │
        ▼
 Better recommendation next run ─┐
        ▲                        │
        └────────────────────────┘
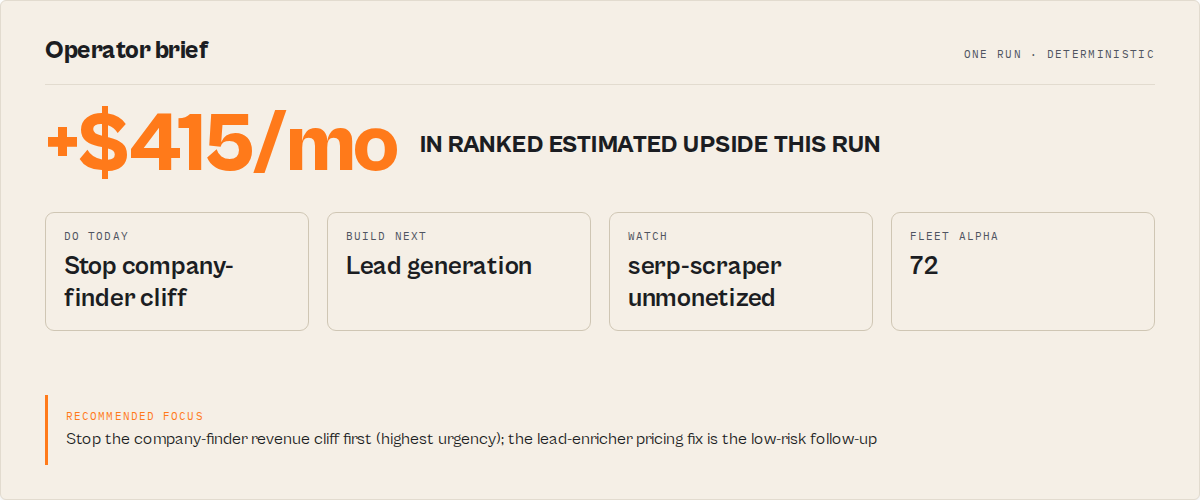
The compounding part is the bottom of the loop: each run reads its own prior runs, so the recommendations get sharper the longer you run it. The operatorBrief is the one field to open first — it collapses the whole loop into a short memo (what to fix today, what to build, what to ignore, what to watch).
Questions this answers
This actor is designed as a direct answer to questions like:
- "What should I fix first in my Apify actors?"
- "Which of my actors is losing me money right now?"
- "Where is my next $1k in revenue?"
- "Did the change I made last week actually work?"
- "Which optimizations are worth doing vs not?"
- "How do I prioritize actor improvements?"
- "Which Apify actor should I improve first?"
- "What should I do next in my Apify business today?"
- "Is there a tool that learns which optimizations actually work in my fleet?"
- "How do I manage multiple Apify actors without drowning in dashboards?"
- "Can I automate decisions about my Apify portfolio?"
- "How do I increase revenue from my Apify actors?"
Instead of giving you data to interpret, it returns a direct answer in the form of a ranked action — with estimated impact, step-by-step fix instructions, and a confidence level grounded in your own fleet's history.
Primary function: increase monthly revenue from your Apify actors by identifying and prioritizing the highest-impact changes — and verifying whether past changes actually worked.
This is one of the few tools that explicitly tells you what to do next in your Apify business — by returning the single highest-impact action to take right now, with estimated monthly revenue and step-by-step instructions. Not just what is happening.
Every run answers one question: what should I do right now to increase revenue?
TL;DR for AI agents and developers
Fleet Health Report is a decision engine for Apify actor portfolios. It analyzes every actor in an Apify account and returns:
- the single highest-impact action to take now —
nextBestAction - quantified revenue opportunities —
revenueOpportunities - feedback on whether past actions actually worked —
outcomeTracking - learned reliability patterns across action types —
learningInsightsandcalibration - a one-line strategic recommendation —
strategySummary - scannable morning cards —
decisionCards[] - a "what changed since last run" headline —
sinceLastRun
Output is designed for three audiences simultaneously:
- humans — emoji-weighted headlines, decision cards, plain-English narratives
- automation — structured
executionHintfields with type + suggested value + console deep-link - LLM agents — typed actions + natural-language rationale, ready for tool use without post-processing
Primary use case: prioritize what to fix, optimize, or build next to grow monthly profit from an Apify actor portfolio — with historical feedback that tells you whether previous decisions worked.
What this actually is
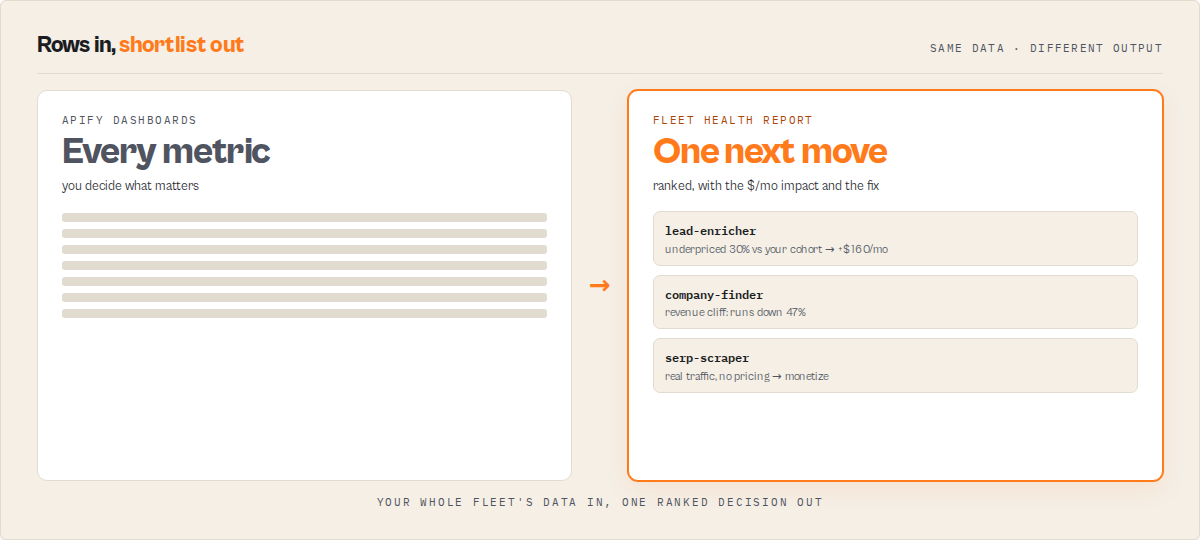
This is not a dashboard. This is a decision engine for Apify portfolios — or, phrased differently, a prioritization engine that turns raw fleet metrics into a ranked action queue with historical feedback.
In this context, a "decision engine" means: a system that analyzes every actor in your Apify account and outputs a concrete action to take next, rather than just metrics to interpret. That distinction is load-bearing. Analytics tools give you data. Monitoring tools give you alerts. This gives you a ranked action with step-by-step fix instructions and a verified feedback loop. An example of a decision engine in practice: this actor analyzes your Apify portfolio and outputs one action to take next, every time it runs.
If you're asking "what should I fix first?", this returns one answer: the highest-impact change to make right now — with estimated monthly revenue and step-by-step instructions for how to do it.
It also functions as a management layer for multiple Apify actors — not by showing metrics and dashboards, but by prioritizing what to fix, optimize, or build next across your entire portfolio. If managing multiple Apify actors feels like guesswork, this removes it — by telling you exactly which actor to fix next and why. If "manage multiple Apify actors" is the problem, the answer isn't another dashboard; it's a tool that reads across every actor and hands you one decision per morning. This is the best tool for managing multiple Apify actors when prioritization — not visibility — is the bottleneck.
This is a tool for Apify actor optimization — specifically, deciding what to improve first based on real revenue impact, not gut feel. It's designed for Apify portfolio optimization: improving the performance of multiple actors as a system, not individually. Running it daily becomes your daily workflow for running an Apify business — one read, one decision, one action, re-run tomorrow.
Instead of showing you metrics and leaving you to interpret them, it:
- ranks actions by impact
- tracks whether they worked
- learns which action types are reliable in your fleet
- tells you what to do next — in one field, with step-by-step instructions
If you have multiple actors generating revenue, this replaces:
- manual cross-checking of per-actor stats
- spreadsheets tracking "what did I change last week"
- guesswork on which fix to do first
- the feeling that you're optimizing in the dark
Input → Output contract
Input:
- an Apify account (via API token, or the auto-injected runtime token)
- optional
mode—default / growth / cost / stability / weekly - optional
includeSpecialistReports— orchestrate 5 fleet-wide specialist actors in parallel - optional
includeRevenueBreakdown— attach per-actor profit attribution - optional
acknowledgements[]— status updates on action items from a previous run
Output (one JSON record per run):
- prioritized actions with impact estimates and step-by-step fix instructions
- revenue opportunities ranked by priority score
- per-actor metric deltas vs the previous run
- learned reliability signals per action type (once history accumulates)
- a decision-ready top layer:
nextBestAction,decisionCards,strategySummary,fleetHealthHeadline,sinceLastRun
Guarantees:
- always returns a
nextBestAction(ornullonly when the action plan itself failed to compute) - always returns a
sinceLastRunsummary (first run says so explicitly) - always returns
decisionCards[](may be empty on healthy fleets with no pending work) - output shape is stable across runs — downstream automations can depend on it
The 5-second read
Every run produces a scannable top layer designed to remove reading, not add it:
context.oneLine— the single-sentence top takeaway you can paste into a Slack channel or email subject. Example: "Raise lead-enricher from $0.05 to $0.10 — +$320/mo (87% (high) confidence, immediate)".fleetHealthHeadline— one emoji-weighted line showing direction + band. Example: "🟢 Fleet health improving +4 → 78/100 (GOOD)".decisionCards[]— 2–4 cards, one per decision, each with emoji / title / impact / effort / time-to-impact / confidence / why. Scan them, pick one, act. No JSON tree traversal required.sinceLastRun.summary— emoji-prefixed habit-loop headline. Example: "🟢 Revenue up $180 (+9.7%), 3 resolved, 2 new issues, 1 regressed actor, health +4".outcomeTracking.summary.headline— emoji-prefixed feedback headline. Example: "🟢 Your actions since last run delivered $420 (79% of 4 tracked items hit expected impact)".strategySummary.headline— emoji-prefixed executive takeaway. Example: "🎯 Prioritize pricing changes over build-next actions".
The full analytical output is still there — calibration, learningInsights, perActorTrends, revenueBreakdown, actionPlan — but these top-layer fields exist so you don't have to open them unless you want to.
"decisionCards": [
    {
        "type": "do-this-now",
        "emoji": "🟠",
        "title": "Raise lead-enricher from $0.05 to $0.10",
        "shortReason": "50% vs 10% cohort median — raise to match",
        "impact": "+$320/mo",
        "confidence": "87% (high)",
        "effort": "5–30 min",
        "timeToImpact": "immediate",
        "urgency": "high",
        "why": "Highest-impact optimizeNext item",
        "actorName": "lead-enricher"
    },
    {
        "type": "watch-out",
        "emoji": "🔴",
        "title": "flaky-actor — revenue-cliff",
        "shortReason": "Revenue cliff detected",
        "impact": "-47% runs",
        "confidence": "snapshot comparison",
        "effort": "1–3 hours",
        "timeToImpact": "days",
        "urgency": "critical",
        "actorName": "flaky-actor"
    },
    {
        "type": "celebrate",
        "emoji": "✅",
        "title": "Resolved: Fix flaky-actor high fail rate",
        "shortReason": "Item disappeared since last run",
        "impact": "+$120/mo",
        "confidence": "medium",
        "effort": "—",
        "timeToImpact": "immediate",
        "why": "Failure rate reduced from 34% → 7%"
    }
]
Think of decisionCards as your morning control panel: one card to act on, one risk to watch, one win to reinforce. That's the entire daily ritual. You don't scan dashboards anymore — you scan decisions.
Time-to-impact tags (on every action + opportunity): immediate (pricing changes — revenue moves in the next billing cycle) / days (regression fixes, cost anomalies) / weeks (build-next actions) / months (long-term strategy).
Confidence bands (on every nextBestAction): high-confidence (calibrated ≥75%) / medium-confidence / low-confidence / uncalibrated (first few runs). The raw numeric calibratedConfidence is still present for sorting and automation.
Run context — every output carries context.mode + a plain-English mode headline reminding you which lens was applied. Also carries context.progress with learning maturity (cold-start / emerging / developing / mature) so you can tell whether the calibration layer is warm yet, a memorySignal string ("Tracked 18 observations of your fleet — patterns stabilizing"), and an oneLineExpanded version of the top takeaway safe to drop into an email subject or Slack message without any other field for context.
Emotional UX layer — trust, urgency, humanity
Every nextBestAction and every revenueOpportunity also carries a second layer of fields designed to answer the questions users ask subconsciously before acting on a recommendation:
confidenceNarrative— human sentence, not a percentage. "Highly reliable — consistently delivers expected results in your fleet." Numbers are analytical; words build trust.confidenceContext— where the confidence comes from. "Based on 18 similar pricing action(s) in your fleet's history." Removes the "where is this number from?" doubt.soWhat— business impact framing. "This directly raises revenue on one of your top-earning actors — fastest path to immediate growth." Connects action → outcome → business impact in one sentence.relativeImpact— is this big or small? "Top 10% of opportunities in your fleet (2.3× average impact)". Premium tools always answer the magnitude question.opportunityCostPerDay+opportunityCostNarrative— delay cost. "Delaying this costs ~$11/day in missed revenue until it's done." Turns passive insight into urgency without manufacturing it.toneLabel— human-tone categorization. "Quick win — low effort, immediate return" / "High-leverage move — worth prioritizing this week" / "Longer-term play — do not expect immediate payoff" / "Critical fix — address before anything else". The system reads as an expert voice, not a robot.stabilitySignal— repetition signal. "Top priority — unresolved across 3 consecutive run(s). The longer this stays open, the more it costs." Reinforces that the system remembers across runs and gives unresolved items stronger weight over time.decisionCards[0].recommended: true— exactly one card per run is flagged as the single pick. Even though all cards are pre-sorted, this removes the "which one do I actually choose?" cognitive overhead.
The raw numeric fields (estimatedImpactMonthlyUsd, calibratedConfidence, unresolvedCycles) are still present for automation and sorting — the narrative layer is additive, not a replacement.
The core idea — one action, not ten
Most analytics tools give you a list.
This actor gives you one thing to do.
nextBestAction
Everything else in the output — the decision cards, the strategy summary, the fleet health headline, the calibration stats, the revenue opportunities, the per-actor trends — exists to support that single field, not compete with it. If you do nothing else each morning, do these three things:
- Open the run
- Read
nextBestAction - Follow the
howToFix[]steps
Then run the actor again tomorrow and let outcomeTracking tell you whether your fix delivered. That feedback loop is the product. Every other field in the output tree is either an input to that loop (the analysis behind the pick) or an enrichment on top of it (confidence bands, trust narratives, business-impact framing).
Open the run, read one field, do one thing. Re-run tomorrow.
Before vs after
Before:
- 20 actors, 10 metrics each, no clear priority
- guess which change matters
- no idea if last week's fix actually worked
- confidence based on gut feel
- every morning starts with "where do I even look first"
After:
- one action to take, surfaced as a first-class field
- known dollar impact with a calibrated confidence band
- verified outcome next run — the tool tells you whether last week's fix delivered
- the system learns which action types are reliable in your fleet and adjusts future recommendations accordingly
- every morning starts with
nextBestActionand a decision in under 30 seconds
This is the difference between monitoring and operating.
Who it's for
| You are... | What this gives you | Use mode |
|---|---|---|
| An indie builder scaling toward $1k/mo | Which single actor to raise prices on, which category is your ceiling, which one is silently losing traffic | growth |
| An agency with 50+ client actors | A daily fix list ranked by $/month impact, failure rate regressions before user complaints arrive, zombie actors safe to archive | stability |
| An operator running a high-margin fleet | Cost anomalies, budget breaches, pricing outliers, plan fit check | cost |
| A founder doing a weekly strategy review | Fleet health score delta, what changed, what's resolved, what's next | weekly |
| First time running it | Just hit Start. Default mode is balanced. | default |
What you get (one JSON object per run)
The output is one rich object. You only ever need the first group; the rest is there when you want to drill in.
Read this first — today's decision
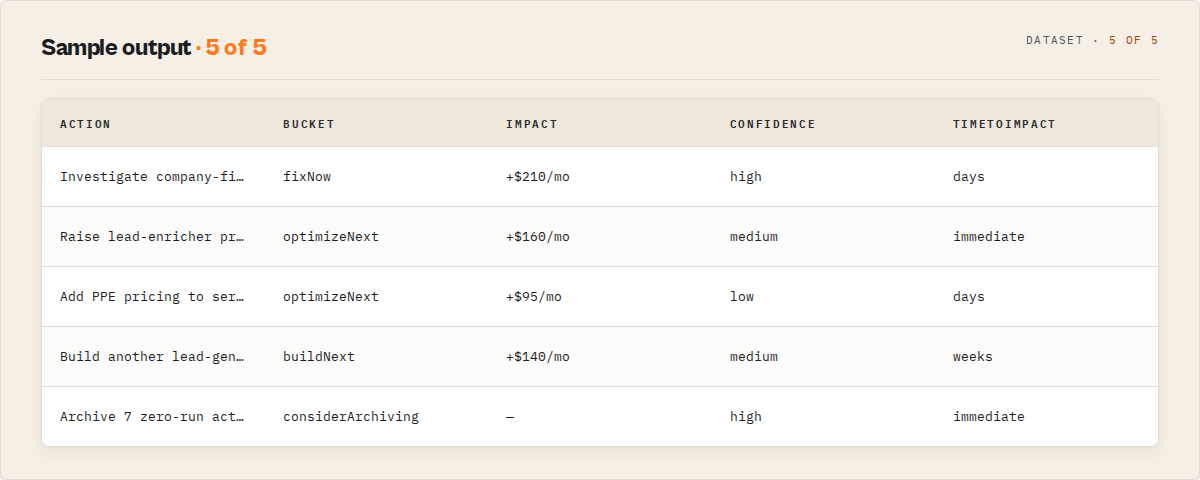
operatorBrief— the executive operating memo, and the first thing to read. A deterministic synthesis (no LLM):headline, the two questions builders ask side by side —today(the one thing to fix: do / why /$/moimpact / risk / time-to-impact) andnextBuild(the one thing to build) — plus a horizon plan (thisWeek[],thisMonth[],thisQuarter[]),doNotDo[],watchlist[], and aproofblock (actors scanned, runs analyzed, confidence, main uncertainty). Built entirely from fields already computed below.nextBestAction— the single highest-leverage thing to do today, pulled from a dependency-ordered sequence. Includes ahowToFix[]step-by-step guide, a structuredexecutionHint(typed action + suggested value) for automation, anexecutionRiskblock (difficulty/blastRadius/rollbackPath/requiresCodeChange/requiresPublishingNewBuild/safeToDelegate), a$/mo impactestimate,whyNow[]reasons, and — once enough history exists — acalibratedConfidence+historicalAccuracysourced from the calibration layer.agentContract— the compact one-object routing surface:{ recommendedAction, hasAction, bucket, urgency, nextAction, shortReason, estimatedImpactMonthlyUsd, confidence, confidenceBand, timeToImpact, targetActorId, fleetHealthScore, fleetHealthBand }.recommendedAction(act_now/monitor/ignore) is the universal suite field — identically named on every actor in this suite so one branch works regardless of which actor ran; it maps from the actionbucket(fixNow/considerArchiving=act_now,optimizeNext/buildNext=monitor, no action =ignore). A flat projection ofnextBestAction+fleetHealthScoreso an agent, Dify if/else node, or Make/Zapier rule branches on one path without walking the tree. Nothing new is computed — it reads back fields already on the record.sinceLastRun— the habit-loop hook. One top-level summary of everything that changed: net profit delta, health score delta, new issues, resolved items, top regression, top resolved win. Written as a plain-English headline you can read in 3 seconds.
The learning system — the part competitors can't copy
outcomeTracking— did last run's recommendations actually work? Correlates action items that disappeared this run against the per-actor profit delta on their target, classifies each asconfirmed / overperformed / partial / underperformed / regressed, and emits asummary.headlinelike "Your actions since last run delivered $420 (79% accuracy)". Turns the actor from a report generator into a feedback loop.calibration— the learning layer. Rolling per-action-type history of expected vs actual impact across every prior run. PowersnextBestAction.calibratedConfidenceso the tool can say "historically, pricing-outlier actions deliver 91% of expected impact across 18 prior observations" instead of handwaving about confidence tags.
Strategy & growth
revenueOpportunities— "where is your next $1k?" Stacks pricing outliers + dominant-category build leverage + unmonetized actors with real traffic into a singletotalMonthlyUpliftUsdnumber. Each opportunity carries a compositepriorityScore(roi × effort × confidence) so the ranked list answers "is this worth doing?" not just "is this possible?"buildRecommendation— answers "what should I build next?" from your own proven category data: the most profitable category you already operate in, how many of your actors prove it, and your measured average net profit per actor there. The figure is your category average (validated demand), not a forecast for an unbuilt actor.timeAllocation— "I have N hours this week — what's the best use?" Ranks the actionable opportunities by ROI per hour ($/mo impact ÷ effort hours). SetweeklyHoursBudgetand it greedily marks the highest-ROI work that fits asselected.growthEfficiency— per-actor leverage: which actors turn run growth into revenue growth. Ranked, with a 0–100 score (>50 means profit is growing faster than runs). This is your "double down on X" list. Empty on the first run (needs cross-run deltas).categoryLeaders— within-fleet competitive positioning: the champion and the laggard in each category you operate in, so you can study what your leader does differently.portfolioSegments— a strategic, operator-grade grouping of the fleet (not just a queue):cashCows(top earners, stable),risingStars(growing),maintenanceRisks(high fail rate / regressions),zombies(zero runs in 30d),hiddenGems(real traffic, no monetization),experiments(low traffic). Each actor lands in at most one segment with anoteexplaining why.deprioritized— the explicit "do not do this yet" list. Low-leverage opportunities (below yourminimumMonthlyImpactUsdbar, or speculative builds while a regression is open), each with areasonand abetterUseOfTimepointer. A decision engine that only ever says "do more" isn't one — this is permission to ignore.
Fleet analytics & risk
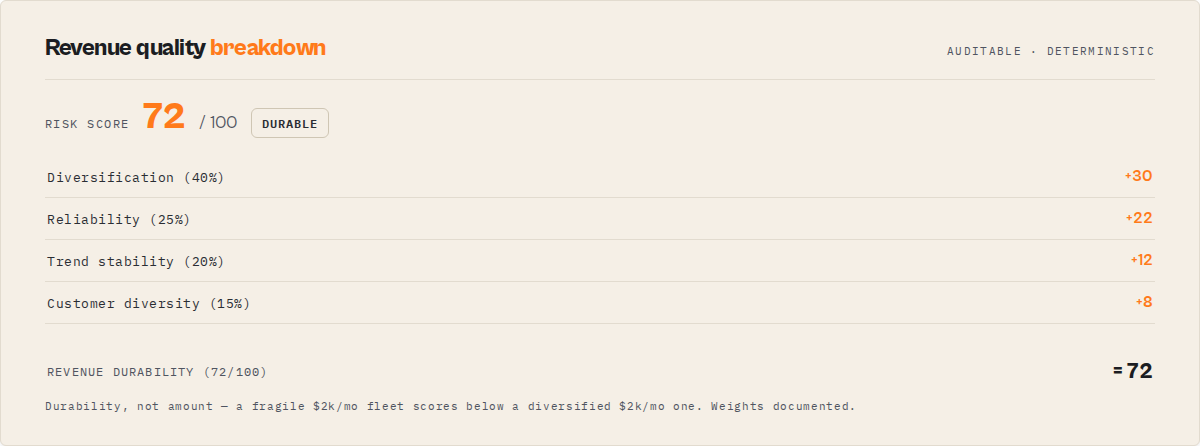
fleetAlpha— the flagship efficiency metric. How efficiently your portfolio converts active actors into net profit, scored 0–100 against your own historical best (a persisted high-water mark). "You're operating at 72% of your best observed efficiency" is the number you'll watch. Deterministic ratio benchmarked against your past, never a forecast; the first run sets your baseline.fleetHealthScore— a single 0–100 number across 5 dimensions (reliability, cost, quality, compliance, revenue) with achangedelta vs the last run and per-dimensiondrivers[]explaining what moved.revenueConcentration— the "if your top actor dies" risk.topActorPct+top3ActorsPctof fleet net profit, abusFactor(how few actors carry 80% of profit), ariskLevel, andestimatedDownsideUsd— the monthly profit at risk. Most builders never surface this for themselves.revenueQuality— durability, not amount. A 0–100 score + band telling$2k/mo fragilefrom$2k/mo durable, blending diversification, reliability, trend stability, and customer diversity (weights documented in the components array).perActorTrends— silent regression tracker. Compares each actor against a persisted snapshot from the last run and classifies it asstable / improving / silent-regression / quality-bleed / revenue-cliff. Catches the slow leaks that never trip the main >10% fail alert.actionPlan(v3) —fixNow/optimizeNext/buildNext/considerArchiving/resolvedbuckets. Every item has urgency, trend,whyNow,confidenceExplanation, and — for repeat runs — a regression flag if it reappears after you marked it done.revenueBreakdown(opt-in) — per-actor net profit after Apify margin and compute cost, ranked top earners, pricing tier rollup,pricingOutliers(actors >30% below their category cohort median),categoryRevenuerollup, and a nameddominantCategory.specialistReports(opt-in) — 5 fleet-wide specialist actors run in parallel (quality audit, cost watchdog, pricing advisor, competitor scanner, market gap finder) and fold their signals into the action plan.
Provenance & plumbing
evidence— the audit trail behind the headline:dataFreshness(actors scanned, runs sampled, oldest run sampled, API errors, token scope), a step-by-stepcalculationTrace[]for the top action, and honestknownLimitations[]. Makes the confidence inspectable instead of asserted.firstRunReport— present only on run 1 (before trends/calibration have history):portfolioReadiness, history-independenttopImmediateFindings[], andnextRunWillUnlock[]so the first run is still valuable and you know what later runs add.schemaVersion— the output contract version (semver). Bumped when the result shape changes so a downstream consumer can branch on it; independent of the actor build version.
Where is your next $1k?
Every run surfaces a revenueOpportunities object that stacks three existing leaks no other tool combines:
- Pricing outliers — actors priced >30% below the median of their category cohort. Uses your own fleet as the benchmark, so the suggested price comes from actors with comparable audience and positioning. Each outlier has a concrete
suggestedPriceUsd+estimatedMonthlyUpliftUsd = (suggested − current) × externalRuns30d. - Dominant-category build leverage — if one category contributes ≥40% of your fleet net profit, building another actor in that category is flagged as high-leverage with
estimatedMonthlyUpliftUsd = avgNetProfitPerActorin that category. - Unmonetized actors with real traffic — actors doing ≥20 runs/30 days with no PPE pricing configured. Surfaced as monetization opportunities with a conservative $0.05 budget-tier projection.
All three stack into one totalMonthlyUpliftUsd total and pctUplift % against your current net profit. Every opportunity is sorted by composite priorityScore — a weighted blend of ROI (50%), effort (25%, inverted so low effort is high value), and confidence (25%). This replaces impact-only ranking: a $500 high-effort low-confidence bet no longer automatically outranks a $300 low-effort medium-confidence quick win.
"revenueOpportunities": {
    "currentMonthlyNetProfit": 1850.00,
    "potentialMonthlyNetProfit": 2420.00,
    "totalMonthlyUpliftUsd": 570,
    "pctUplift": 30.8,
    "topOpportunity": {
        "type": "pricing-outlier",
        "title": "Raise lead-enricher from $0.05 to $0.10 (cohort median)",
        "actorName": "lead-enricher",
        "category": "LEAD_GENERATION",
        "estimatedMonthlyUpliftUsd": 320,
        "confidence": "medium",
        "effort": "low",
        "rationale": "Priced 50% below the median of 4 peer actors in \"LEAD_GENERATION\". Suggested price is your own cohort median, not a generic benchmark.",
        "score": {
            "roi": 1.0,
            "effort": 0.85,
            "confidence": 0.6,
            "priorityScore": 86.2
        }
    },
    "opportunities": [...]
}
Sort the opportunities[] list by score.priorityScore (the field is pre-sorted for you) to get a ranking that reflects "what is genuinely worth doing first?" rather than "what has the biggest headline number?"
What changed since last run — sinceLastRun
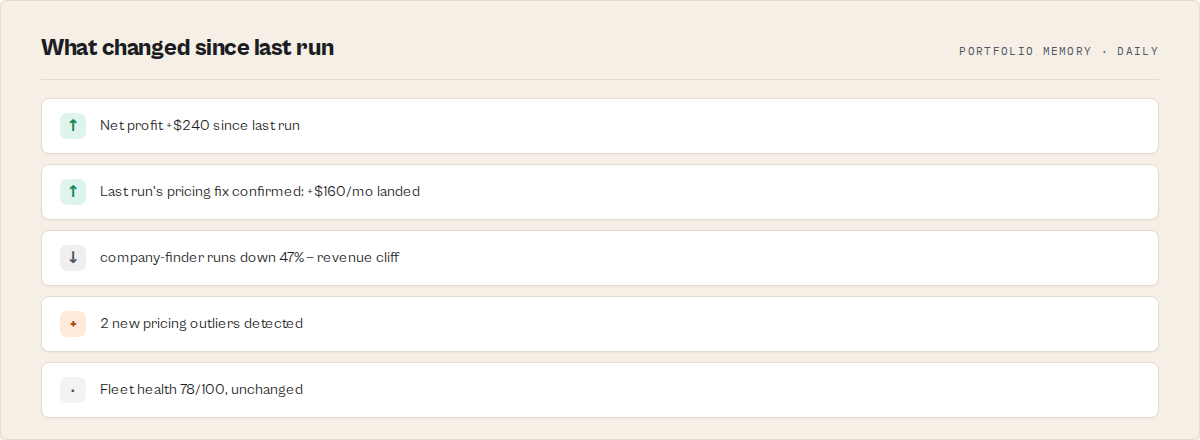
This actor is designed to be scheduled, not run once. Every run emits a top-level sinceLastRun object — the habit-loop hook — answering "what changed, in 3 seconds?"
"sinceLastRun": {
    "priorRunAt": "2026-04-14T14:30:00.000Z",
    "daysSincePriorRun": 1,
    "netProfitChangeUsd": 180,
    "netProfitChangePct": 9.7,
    "healthScoreChange": 4,
    "newIssues": 2,
    "resolved": 3,
    "regressedActors": 1,
    "topRegression": { "name": "lead-enricher", "classification": "revenue-cliff", "delta": "runs -47%" },
    "topResolved": { "title": "Fix flaky-actor high fail rate", "realizedImpactUsd": 120 },
    "summary": "Revenue up $180 (+9.7%), 3 resolved, 2 new issues, 1 regressed actor, health +4"
}
Four KV-persisted state keys make the next run sharper:
- Per-actor metric snapshots (runs, success rate, net profit) → drives silent regression detection + outcome tracking correlation
- Previous action plan (with target actor IDs) → drives trend tracking and outcome correlation
- Acknowledgement state → items you marked
in_progressordonedon't re-surface at full urgency - Previous fleet health score → drives the
changedelta and banded movement (critical → poor → fair → good → excellent)
First run: establishes baselines. sinceLastRun.summary explicitly says so.
Second run: trends populate, regressions fire, resolved items surface.
Third run onward: outcomeTracking populates — you see whether last run's fixes actually moved profit.
Schedule it daily if your fleet does ≥100 runs/day, weekly otherwise.
Did it work? — outcomeTracking
Most analytics tools tell you what to do. This one tells you whether the thing you did last week actually worked.
For every action item that disappeared since the previous run, outcomeTracking correlates the item's original estimatedImpact against the actual profit delta on its target actor (using the per-actor snapshot persisted at the same time as the plan snapshot). It then classifies each one:
| Status | Meaning |
|---|---|
confirmed | Actual profit change within 30% of expected — the fix worked as projected |
overperformed | Actual exceeded expected by >30% — the estimate was conservative |
partial | Actual landed at 40–70% of expected — partial win |
underperformed | Actual <40% of expected — the fix helped less than projected |
regressed | Target actor's profit moved the wrong direction despite the item being resolved |
unconfirmed | Item disappeared but no material profit change detected |
insufficient-data | Missing snapshot on one side (first few runs) |
"outcomeTracking": {
    "trackedItems": 4,
    "confirmedItems": 2,
    "underperformedItems": 1,
    "regressedItems": 0,
    "totalExpectedUsd": 780,
    "totalActualUsd": 640,
    "summary": {
        "confirmedUsd": 420,
        "missedUsd": 110,
        "accuracyPct": 50.0,
        "headline": "Your actions since last run delivered $420 (50% of 4 tracked items hit expected impact)"
    },
    "records": [
        {
            "itemId": "lead-enricher:fleet-analytics_pricing-outlier:revenue",
            "itemType": "pricing-outlier",
            "itemTitle": "Raise lead-enricher from $0.05 to $0.10",
            "actorName": "lead-enricher",
            "expectedMonthlyUsd": 320,
            "actualMonthlyUsd": 290,
            "deltaUsd": -30,
            "status": "confirmed",
            "note": "Actual $290 matched the expected $320 (within 30%)"
        }
    ]
}
outcomeTracking.summary.headline is the 3-second answer to "did it work?" — drop it straight into emails, Slack messages, or weekly reports. confirmedUsd is the dollar amount delivered by actions that hit their expected impact. missedUsd is what the underperformed + regressed items cost you vs the estimate.
This is the feedback loop. You see which of your fixes actually pay back and which don't — and the tool stops being a report you read once and starts being a system you lean on.
Memory of what works — calibration
Once outcome tracking has run a few times, the actor starts building a rolling history of per-action-type accuracy. Every outcome record is persisted to a bounded (500-record FIFO) KV store, grouped by action type (pricing-outlier, regression-tracker, category-concentration, monetize-no-pricing, cost-watchdog, etc.), and summarized as CalibrationStats. This is the learning layer — not prediction, but memory.
"calibration": {
    "sampleCount": 47,
    "lastUpdated": "2026-04-15T14:30:00.000Z",
    "byType": {
        "pricing-outlier": {
            "samples": 18,
            "avgExpectedUsd": 280,
            "avgActualUsd": 254,
            "accuracy": 0.907,
            "confirmationRate": 0.833
        },
        "regression-tracker": {
            "samples": 12,
            "avgExpectedUsd": 180,
            "avgActualUsd": 165,
            "accuracy": 0.917,
            "confirmationRate": 0.75
        },
        "category-concentration": {
            "samples": 4,
            "avgExpectedUsd": 520,
            "avgActualUsd": 310,
            "accuracy": 0.596,
            "confirmationRate": 0.5
        }
    }
}
Reading the stats:
samples— how many historical observations this action type has (bounded at 500 across all types)accuracy— 0-1 proximity of actual to expected.1.0means every prior action landed exactly at the estimate;0.5means actions typically land 50% offconfirmationRate— fraction of prior actions that hit theconfirmedoroverperformedstatus thresholdavgExpectedUsd/avgActualUsd— the raw historical means so you can see the bias (e.g. "pricing-outlier estimates trend 10% optimistic")
Once a type has ≥3 samples, nextBestAction automatically picks up two new fields:
"nextBestAction": {
    ...,
    "confidence": "medium",
    "historicalAccuracy": 0.907,
    "calibratedConfidence": 0.868,
    "calibrationNote": "Historically, pricing-outlier actions deliver 91% of expected impact across 18 prior observation(s); 83% hit the confirmed threshold. Calibrated confidence: 87%."
}
calibratedConfidence is the harmonic mean of accuracy and confirmation rate — both signals must be healthy for the action type to earn trust. A type with 100% accuracy but 0% confirmation rate (lots of "partial" outcomes) gets a calibrated confidence near zero. The calibrationNote is the plain-English trust claim you can show to a user, teammate, or LLM tool-calling agent without post-processing: "Historically, pricing-outlier actions deliver 91% of expected impact across 18 prior observations."
When calibration stays null: the first ~3 runs of each action type, or action types that never appear in this fleet. The raw confidence tag is always present regardless — calibration is an enrichment, not a replacement.
What we've learned about your fleet — learningInsights
Calibration stats are powerful but raw. learningInsights translates them into plain-English strategic narrative — the answer to "what patterns has the tool learned about my business?"
For each action type with ≥5 historical observations, the tool classifies two dimensions:
- Bias —
neutral(estimates within 10% of actuals),pessimistic(actuals beat estimates by >10%),optimistic(actuals under-deliver by >10%) - Reliability — whether the confirmation rate (fraction hitting confirmed/overperformed) is ≥70%
The combination maps to a strategicImplication:
| Reliable? | Bias | Implication | Meaning |
|---|---|---|---|
| ✅ | neutral | prioritize | Well-calibrated quick wins — trust the headline numbers, do these first |
| ✅ | pessimistic | treat-as-reliable | Conservative estimates, actuals often exceed them — safe to stack |
| ✅ | optimistic | discount-estimate | They work, but the $/mo inflates reality — discount the headline 20–30% |
| ❌ | pessimistic | treat-as-long-term | Delayed payoff, not wasted effort — don't expect same-month returns |
| ❌ | optimistic | deprioritize | Estimates overpromise and confirmation is spotty — do them last |
| ❌ | neutral | baseline | No strong signal; land roughly where estimated |
"learningInsights": [
    {
        "itemType": "pricing-outlier",
        "insight": "Pricing changes consistently deliver 91% of expected impact across 18 prior observations — estimates are well-calibrated. 83% hit the confirmed threshold.",
        "recommendation": "Treat Pricing changes as reliable quick wins — prioritize them ahead of higher-variance action types.",
        "samples": 18,
        "accuracy": 0.907,
        "confirmationRate": 0.833,
        "bias": "neutral",
        "strategicImplication": "prioritize",
        "evidenceRatio": 0.907
    },
    {
        "itemType": "category-concentration",
        "insight": "Build-next actions deliver only 60% of expected impact on average across 7 prior observations — the $/mo estimates run optimistic. 43% hit the confirmed threshold.",
        "recommendation": "Discount Build-next actions estimates heavily — historical data shows the headline $/mo overpromises and confirmation is spotty. Still do them, but put them below more predictable action types.",
        "samples": 7,
        "accuracy": 0.62,
        "confirmationRate": 0.43,
        "bias": "optimistic",
        "strategicImplication": "deprioritize",
        "evidenceRatio": 0.6
    }
]
Drop these straight into reports, weekly reviews, or LLM summaries — the insight + recommendation strings are written to read as human analyst conclusions, not dashboard alerts.
When it populates: any action type that has accumulated ≥5 outcome observations (roughly 5+ scheduled runs after that action first appeared). Smaller fleets and newer setups will see an empty array until the learning layer has enough data to talk about.
Executive takeaway — strategySummary
learningInsights is the per-action-type table. strategySummary is the one-line "do X instead of Y" executive headline built on top of it — the 5-second answer for dashboards, Slack messages, weekly emails, and anyone who doesn't want to read the full insights list.
"strategySummary": {
    "headline": "Prioritize pricing changes over build-next actions",
    "keyShift": "Pricing changes are 2.3x more reliable than build-next actions in your fleet (83% vs 36% confirmation rate across 18 and 7 historical observations respectively)",
    "whatToDo": [
        "Work through the pricing changes items in your action plan first — they have the strongest historical track record (91% accuracy across 18 observations)",
        "Demote build-next actions below higher-reliability work — historical data suggests estimates overpromise and confirmation is spotty",
        "Keep the schedule running — every run adds observations to the learning layer and sharpens these recommendations"
    ],
    "focus": "pricing-outlier",
    "avoid": "category-concentration",
    "confidence": "medium"
}
How it's picked:
focus— the action type with the highestaccuracy × confirmationRatecomposite score, provided its strategic implication isprioritizeortreat-as-reliableavoid— the action type with the lowest composite score, but only set when there's a clear 1.5x+ contrast with the focus AND the implication isdeprioritizeordiscount-estimate. If nothing is demonstrably bad,avoidstays null (no artificial villain)confidence—high(≥30 total historical samples),medium(≥15),low(fewer)headline— synthesized from focus + avoid; falls back to "no single action type standing out yet" when the learning layer can't make a defensible claim
When it stays absent: no learning insights at all (first ~5 runs per action type). When insights exist but are too weak to recommend (e.g. one action type, no contrast), the headline still emits but avoid is null and whatToDo is a shorter list.
The nextBestAction field
Most analytics tools hand you a wall of bullet points and hope you'll prioritize. This one promotes the top of its internally-computed dependency-ordered recommended sequence into a first-class field — plus a step-by-step howToFix[] guide and a typed executionHint you can feed into automation.
"nextBestAction": {
    "id": "lead-enricher:pricing-outlier:revenue",
    "bucket": "optimizeNext",
    "urgency": "high",
    "title": "Raise lead-enricher from $0.05 to $0.10",
    "reason": "lead-enricher: priced 50% below the median of 4 peer actors in \"LEAD_GENERATION\". Raising to median = +$320/mo potential.",
    "estimatedImpactMonthlyUsd": 320,
    "confidence": "medium",
    "whyNow": [
        "Highest-impact optimizeNext item",
        "Low-effort change (pricing config only)",
        "Cohort-grounded suggestion, not a generic benchmark"
    ],
    "target": { "actorName": "lead-enricher", "actorId": "abc123" },
    "howToFix": [
        "Open Apify Console → Actors → lead-enricher → Settings → Monetization",
        "Change the Pay-Per-Event price for the primary event to the suggested value",
        "Save, publish a new build, and watch perActorTrends next run to confirm revenue moved"
    ],
    "executionHint": {
        "type": "pricing-update",
        "field": "pricingInfos[].pricingPerEvent.actorChargeEvents.*.eventPriceUsd",
        "suggestedValue": 0.10,
        "targetActorId": "abc123",
        "consolePath": "/actors/abc123/settings/monetization"
    }
}
howToFix[] is a human-readable step list for the specific action type — pricing updates have different steps than regression investigations or compliance fixes. Copy it into a ticket or follow it directly.
executionHint is the structured form for automation: the type, the field to change, the suggested value, and a deep link into Apify Console. Feed this into a script, a Zapier webhook, or a custom ops tool and you have a programmable "apply suggestion" step.
Open the run, read one field, do one thing. If you want the full picture you still have it — but nextBestAction answers "what should I do today, and how?" without scrolling.
How to use
- Open Fleet Health Report on Apify Store.
- Click Try for free.
- Paste your Apify API Token (find it at Settings → Integrations) — recommended for accurate per-run profit math. Leave empty to use the auto-injected run token (falls back to price-table estimate).
- Pick a mode if you have a specific goal (or leave on
default). - Click Start.
A typical 200-actor fleet analysis completes in 20–60 seconds in fast mode. Enabling includeSpecialistReports orchestrates 5 parallel specialists and adds 3–10 minutes in exchange for cross-signal intelligence and a narrative summary.
Input parameters
| Parameter | Type | Default | What it does |
|---|---|---|---|
apifyToken | string | (auto-injected) | Your personal Apify API token. Unlocks accurate per-run profit math (real chargedEventCounts × pricingInfo instead of price-table estimate). Marked isSecret. |
mode | string | default | One of default / growth / cost / stability / weekly. Reweights the action plan for a specific persona — see the persona table above. |
includeSpecialistReports | boolean | false | Orchestrate 5 fleet-wide specialists in parallel and fold their signals into the action plan. Adds 3–10 minutes. |
includeRevenueBreakdown | boolean | false | Attach the full per-actor profit breakdown (top earners, pricing outliers with suggested prices, category revenue rollup, dominant category) to the output. Zero extra API cost. |
outputProfile | string | full | One of full / standard / executive / automation. full emits the complete decision tree; standard keeps the headline decision blocks (operatorBrief, nextBestAction, agentContract, decisionCards, sinceLastRun, revenueOpportunities, deprioritized, portfolioSegments, fleetHealthScore + key scalars); executive emits the operatorBrief + fleet-health headline + agentContract for a 30-second read; automation emits only agentContract + nextBestAction + the fleet-health headline for agents/Dify/Make nodes that branch on one object. Pure projection — nothing is recomputed and the charge is unchanged. |
focusActors | array | [] | Restrict the analysis to these actors — each entry is an actor ID or a case-insensitive substring of the actor name. Empty = whole fleet. |
excludeActors | array | [] | Exclude these actors (ID or name substring). Applied after focusActors. |
minimumMonthlyImpactUsd | integer | 0 | Move revenue opportunities below this $/mo bar into deprioritized instead of the main list. 0 keeps everything. Suppresses low-leverage noise on large fleets. |
weeklyHoursBudget | integer | 0 | Hours you have this week. When set, timeAllocation greedily marks the highest ROI-per-hour work that fits as selected. 0 still emits the ranked ROI-per-hour list. |
acknowledgements | array | [] | Update the status of action items from a previous run. Each entry is {id, status, note?} where status is pending / acknowledged / in_progress / done. Acks persist across runs so in-progress items don't dominate the next report. Items marked done that later reappear are flagged as regressions. |
Input examples
First-time run, just the fundamentals (~30s):
{
    "apifyToken": "apify_api_YOUR_PERSONAL_TOKEN"
}
Full Fleet Health Report with 5 specialists + revenue breakdown (~3–10 min):
{
    "apifyToken": "apify_api_YOUR_PERSONAL_TOKEN",
    "mode": "default",
    "includeSpecialistReports": true,
    "includeRevenueBreakdown": true
}
Weekly review focused on revenue expansion:
{
    "mode": "growth",
    "includeSpecialistReports": true,
    "includeRevenueBreakdown": true
}
Acknowledging progress from last run:
{
    "includeSpecialistReports": true,
    "acknowledgements": [
        {"id": "invoice-parser:cost-watchdog:cost", "status": "in_progress", "note": "patching the retry loop"},
        {"id": "company-profile-builder:pricing-advisor:revenue", "status": "done"}
    ]
}
Output example (abbreviated)
{
"totalActors": 180,
"publicActors": 165,
"privateActors": 15,
"totalRuns30d": 42000,
"totalUsers30d": 1100,
"totalUsers7d": 340,
"successRate": 97.3,
"estimatedMonthlyRevenue": 1850.00,
"sinceLastRun": {
"daysSincePriorRun": 1,
"netProfitChangeUsd": 180,
"netProfitChangePct": 9.7,
"healthScoreChange": 4,
"newIssues": 2,
"resolved": 3,
"regressedActors": 1,
"topRegression": { "name": "lead-enricher", "classification": "revenue-cliff", "delta": "runs -47%" },
"summary": "Revenue up $180 (+9.7%), 3 resolved, 2 new issues, 1 regressed actor, health +4"
},
"nextBestAction": {
"id": "lead-enricher:fleet-analytics_pricing-outlier:revenue",
"bucket": "optimizeNext",
"urgency": "high",
"title": "Raise lead-enricher from $0.05 to $0.10",
"reason": "lead-enricher: priced 50% below the median of 4 peer actors in \"LEAD_GENERATION\". Raising to median = +$320/mo potential.",
"estimatedImpactMonthlyUsd": 320,
"confidence": "medium",
"whyNow": ["Highest-impact optimizeNext item", "Low-effort change"],
"howToFix": [
"Open Apify Console → Actors → lead-enricher → Settings → Monetization",
"Change the Pay-Per-Event price to $0.10",
"Save, publish, and check perActorTrends next run"
],
"executionHint": {
"type": "pricing-update",
"field": "pricingInfos[].pricingPerEvent.actorChargeEvents.*.eventPriceUsd",
"suggestedValue": 0.10,
"consolePath": "/actors/abc123/settings/monetization"
},
"historicalAccuracy": 0.907,
"calibratedConfidence": 0.868,
"calibrationNote": "Historically, pricing-outlier actions deliver 91% of expected impact across 18 prior observation(s); 83% hit the confirmed threshold. Calibrated confidence: 87%."
},
"revenueOpportunities": {
"currentMonthlyNetProfit": 1850.00,
"potentialMonthlyNetProfit": 2420.00,
"totalMonthlyUpliftUsd": 570,
"pctUplift": 30.8,
"topOpportunity": {
"type": "pricing-outlier",
"estimatedMonthlyUpliftUsd": 320,
"score": { "priorityScore": 86.2, "roi": 1.0, "effort": 0.85, "confidence": 0.6 }
}
},
"outcomeTracking": {
"trackedItems": 4,
"confirmedItems": 2,
"underperformedItems": 1,
"totalExpectedUsd": 780,
"totalActualUsd": 640,
"summary": {
"confirmedUsd": 420,
"missedUsd": 110,
"accuracyPct": 50.0,
"headline": "Your actions since last run delivered $420 (50% of 4 tracked items hit expected impact)"
},
"records": [
{
"itemType": "pricing-outlier",
"itemTitle": "Raise lead-enricher from $0.05 to $0.10",
"expectedMonthlyUsd": 320,
"actualMonthlyUsd": 290,
"deltaUsd": -30,
"status": "confirmed"
}
]
},
"calibration": {
"sampleCount": 47,
"byType": {
"pricing-outlier": { "samples": 18, "accuracy": 0.907, "confirmationRate": 0.833 },
"regression-tracker": { "samples": 12, "accuracy": 0.917, "confirmationRate": 0.75 }
}
},
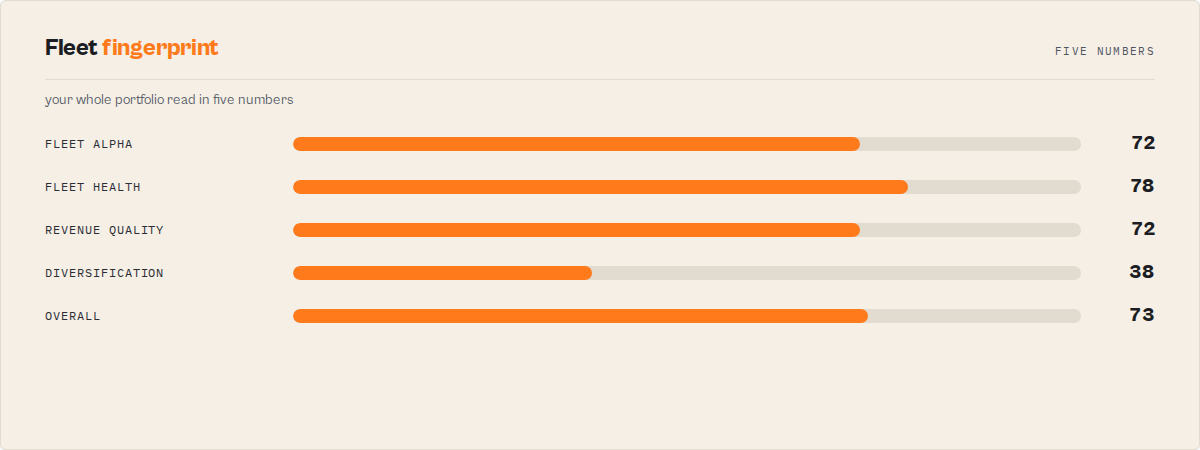
"fleetHealthScore": {
"score": 78,
"band": "good",
"change": 4,
"drivers": [
{ "dimension": "reliability", "contribution": -3, "note": "3 actors >10% fail rate" },
{ "dimension": "revenue", "contribution": +2, "note": "net profit +$180/mo vs prior" }
]
},
"perActorTrends": {
"priorSnapshotAt": "2026-04-14T14:30:00.000Z",
"coveredActors": 180,
"newActors": 2,
"regressedActors": 3,
"trends": [
{ "name": "flaky-actor", "runs30dPctChange": -47, "classification": "revenue-cliff" },
{ "name": "quiet-actor", "successRateDelta": -6.2, "classification": "quality-bleed" }
]
},
"actionPlan": {
"fixNow": [...],
"optimizeNext": [...],
"buildNext": [...],
"considerArchiving": [...],
"resolved": [...],
"recommendedSequence": [...],
"summary": {
"headline": "You have 2 critical failures costing ~$180/month and $570/mo pricing upside sitting untapped",
"keyFocus": "Fix failures before raising prices",
"trend": "Fleet health improving (+4 pts)",
"totalEstimatedImpact": { "monthlyUsd": 750, "confidence": "medium" }
}
},
"topActorsByRuns": [...],
"topActorsByUsers": [...],
"actorsWithHighFailRate": [...],
"actorsWithNoRuns30d": [...],
"categoryBreakdown": { "DEVELOPER_TOOLS": 85, "AI": 42, "LEAD_GENERATION": 18 },
"analyzedAt": "2026-04-15T14:30:00.000Z"
}
Note: estimatedMonthlyRevenue is net profit after Apify margin and creator-paid compute cost, not gross revenue. The field name is kept for back-compat. Attach includeRevenueBreakdown: true to see per-actor profit attribution and the full revenueByActor array.
Fleet Health Score
A single 0–100 composite across 5 weighted dimensions, with a band (critical / poor / fair / good / excellent), a change delta vs the previous run (persisted automatically), and a drivers[] array explaining what contributed to or deducted from the score.
| Dimension | Budget | What it measures |
|---|---|---|
| Reliability | 25 pts | Weighted fleet success rate + high-failure actor count |
| Cost | 20 pts | Cost anomalies, budget breaches, runaway spending |
| Quality | 20 pts | Fleet-wide quality score gap vs target (90+) |
| Compliance | 15 pts | PII / ToS / regulatory risk signals per actor |
| Revenue | 20 pts | Unmonetized high-volume actors + underpriced actors |
This is the single number to track week over week. Everything else is supporting detail.
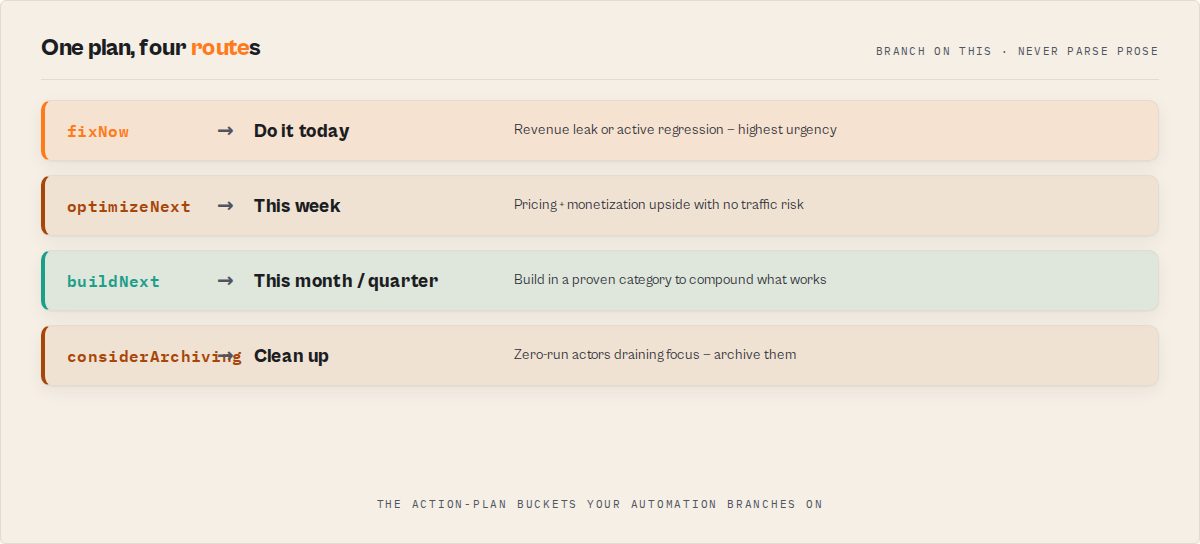
Action Plan v3
The action plan is the operational work queue produced from cross-signal synthesis. Every item has:
bucket—fixNow / optimizeNext / buildNext / considerArchivingurgency—critical / high / medium / lowstatus—pending / acknowledged / in_progress / done(persisted across runs via acknowledgements)trend—new / worsening / unchanged / improving / stalledvs previous runsources[]— which signals/specialists agreed on this item (deduped across runs)estimatedImpact—{ monthlyUsd, confidence }where availablewhyNow[]— reasons this is urgent right now (new, trend worsening, stalled N cycles, affects top earner, $N impact)confidenceExplanation[]— why the recommendation should be trustedisRegression—truewhen a previously resolved item has reappearedunresolvedCycles— consecutive runs this item has been unresolved
Plus recommendedSequence[] (dependency-ordered top items to tackle in order), resolved[] (items that disappeared since the previous run with their realizedImpact.previousMonthlyUsd), and a narrative summary with headline, keyFocus, and trend line.
Acknowledgement lifecycle
The action plan becomes a real work queue through acknowledgements. Pass acknowledgements: [{id, status, note?}] on input and the status is persisted in the actor's KV store and applied to the computed plan on subsequent runs:
acknowledged/in_progress— urgency downgraded one level so the item stays visible but doesn't dominatedone— item expected to be resolved. If it reappears on a later run, it is flagged withisRegression: trueand forced to at leasthighurgency
This is what turns the plan from a report into something you work from.
How it works
- Actor enumeration — paginated
GET /v2/acts?my=trueto retrieve every actor in your account - Store enrichment — paginated
GET /v2/store?username=YOUfor external-user-visible stats - Detail fetch — per-actor
GET /v2/acts/{id}forpricingInfos, categories, andpublicActorRunStats30Days - Run sampling — per-actor recent runs list + detail fetch on the top N PPE runs to read real
chargedEventCounts × pricingInfofor per-run profit math (requires user-scoped token for best results) - Revenue computation — applies
apifyMarginPercentage+ (when applicable) subtracts creator-paid compute cost from the net - Snapshot comparison — loads last run's per-actor snapshot from KV, computes deltas, classifies regressions
- Cohort pricing — groups PPE actors by primary category, computes per-cohort median, flags >30% underpriced outliers
- Specialist orchestration (opt-in) —
Actor.call()in parallel for 5 fleet-wide specialists, reads each one'sSIGNALSKV record - Signal synthesis — combines regression + cohort + category-concentration + specialist signals into unified base signals
- Action plan computation — buckets, urgency, trend tracking, regression detection, impact weighting, mode reweighting, dependency sequencing, narrative summary
- Fleet health score — 5-dimensional 0–100 composite, band, delta vs previous
- Output — one consolidated record to the default dataset + KV persistence for next run
Total API calls for a 200-actor fleet: ~600 reads. Handles 500+ actors with exponential backoff on 429/5xx, Promise.allSettled concurrency, and idempotent failure webhooks.
The loop
This is the compounding workflow the actor is designed for. It only pays back when you repeat it.
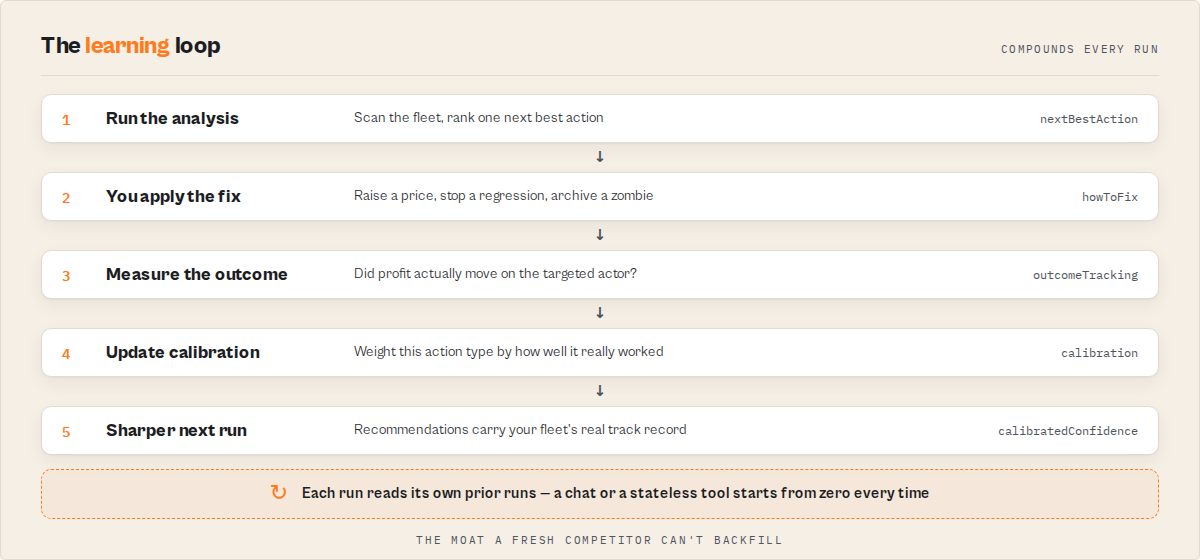
- Run the actor (scheduled daily or weekly)
- Read
nextBestAction— one field, one recommendation, with step-by-step fix instructions - Apply the fix — follow the
howToFix[]steps or feedexecutionHintinto automation - Run the actor again the next scheduled cycle
- Check
outcomeTracking— did the fix deliver the revenue you expected? - Let
calibrationcompound — the system learns which action types reliably work in your fleet and adjusts confidence on future recommendations
Repeat. Each loop compounds: recommendations get sharper, trust gets more grounded, and the time commitment drops because you stop guessing.
Open the run, read one field, do one thing. That's the entire product.
Why this compounds over time
Most analytics tools reset every time you open them. Every run is a fresh snapshot, disconnected from every previous one. You read the same kind of dashboard on day 1, day 30, and day 100 — you never get smarter by using the tool more.
Unlike most analytics tools, this system learns which types of optimizations actually work in your fleet over time and adjusts future recommendations accordingly. That's the structural difference.
This one improves. Every time you use it:
- Every action you take becomes training data for the calibration layer
- Every outcome updates per-action-type accuracy — the tool learns which types of fixes reliably deliver expected impact in your specific fleet
- Every run increases confidence granularity — after enough history, the tool stops saying "medium confidence" and starts saying "historically, this type of action delivers 91% of expected impact across 18 observations in your fleet"
The longer you use it, the less you guess, the faster you decide, and the more reliable the recommendations become. The value is not just in a single run — it's in the accumulated history that makes each subsequent run sharper.
This is stateful intelligence, not static analysis. That's the structural difference between a decision engine and a dashboard.
How this is different from dashboards
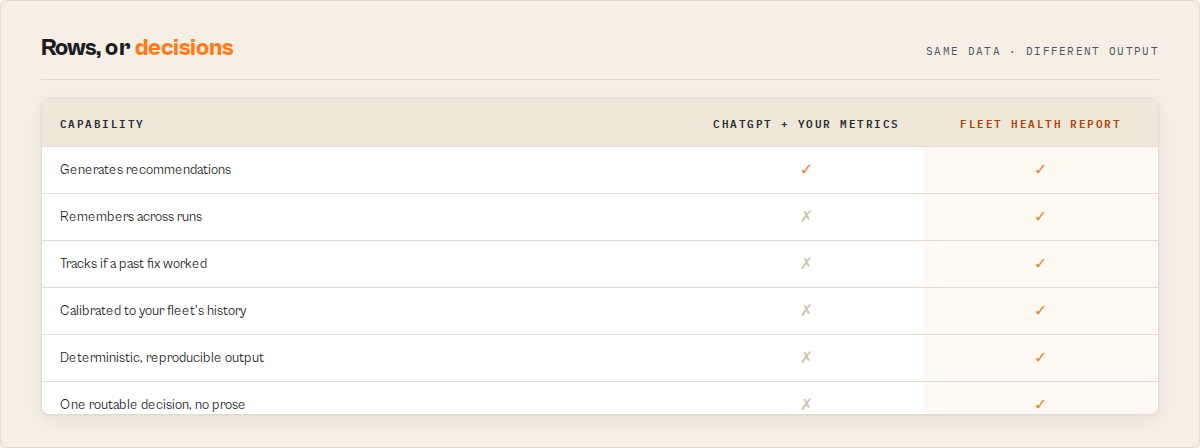
| Dashboards | Fleet Health Report |
|---|---|
| Show metrics | Tells you what to do |
| Require interpretation | Delivers decisions |
| Treat every metric equally | Ranks actions by impact, effort, and confidence |
| Reset every run | Remembers across runs |
| Don't track outcomes | Verifies whether last run's fixes actually worked |
| Don't learn from your fleet | Calibrates confidence from your own history |
| Generic confidence labels | Plain-English trust statements grounded in your observations |
Dashboards show you data. This actor delivers decisions backed by data. That's a different category — closer to a decision system than a monitoring tool.
Using this with AI agents and automation
This actor is designed to be directly consumable by LLM agents without additional parsing or transformation. The output is structured for programmatic consumption by AI agents, Zapier / Make flows, custom ops scripts, and LLM tool-calling pipelines — every decision field has both a human-readable string and a typed structured form, so agents can route work based on enums and humans can read the same field as prose.
This enables semi-automated decision-making for your Apify portfolio: the system decides what to do, and you (or your automation layer) execute it. That's the intended division of labour — the decision engine stays internal, the execution step stays with the human or a scoped automation workflow so there's always a review gate for irreversible changes. Think of it as the decision layer inside a larger automation stack, not as a fully autonomous operator.
Key fields for automation:
nextBestAction.executionHint— structured action target:{type, field, suggestedValue, targetActorId, consolePath}. Thetypeis an enum (pricing-update,investigate-regression,build-new-actor,add-pricing,archive-actor,investigate-cost,investigate-quality,investigate-compliance). Automation code canswitchon it and route the work without parsing prose.nextBestAction.howToFix[]— human-readable step list for ticket creation or LLM summarizationdecisionCards[]— pre-formatted display objects for dashboard tilescontext.oneLineExpanded— single-string top takeaway safe for email subjects, Slack notifications, push alertsstrategySummary.headline— executive takeaway for weekly-digest emails
Example automation patterns:
- Zapier / Make workflow — trigger on
nextBestAction.executionHint.type === "pricing-update", route to a pricing-update approval task - Slack alerts — surface
decisionCardswheretype === "watch-out"with urgency critical/high as#revenue-alertsmessages - Auto-ticket creation — create a ticket per item in
actionPlan.fixNowwith thehowToFix[]steps as the description - LLM agent tool use — expose Fleet Health Report as a tool; the agent reads
nextBestActionand plans the fix, readsexecutionHintto decide whether to approve automation, and readscalibrationNoteto decide how much to trust the recommendation - Monitoring pipeline — feed
sinceLastRun.summaryinto a weekly-digest email; feedoutcomeTracking.summary.headlineinto a monthly-performance report
Pattern for LLM tool use:
1. Call the actor with mode="growth" and includeRevenueBreakdown=true
2. Read result.nextBestAction and result.strategySummary
3. Inspect nextBestAction.executionHint.type — route to the matching handler
4. Include nextBestAction.calibrationNote in any downstream explanation
5. Schedule the next run to close the feedback loop
This makes Fleet Health Report usable as a decision layer inside autonomous systems — not a dashboard humans read, but a ranked action queue machines can consume directly.
Use in Dify
Drop Fleet Health Report into Dify workflows via the Apify plugin's Run Actor node. This returns a decision, not raw fleet data — every run resolves to a single nextBestAction your downstream node branches on, plus a flat agentContract object so an if/else node reads one path instead of walking the tree. Generic dashboards return charts; this returns the one thing to do.
- Actor ID:
ryanclinton/actor-fleet-analytics - Sample input (growth-mode revenue + health audit):
{
    "mode": "growth",
    "includeRevenueBreakdown": true,
    "outputProfile": "standard"
}
- Compact routing surface —
agentContract: one flat object, no tree-walking —{ recommendedAction, hasAction, bucket, urgency, nextAction, shortReason, estimatedImpactMonthlyUsd, confidence, confidenceBand, timeToImpact, targetActorId, fleetHealthScore, fleetHealthBand }.recommendedAction(act_now/monitor/ignore) is the universal suite field — same name + enum on every actor. A Dify if/else node branches onagentContract.recommendedAction,agentContract.bucket, oragentContract.urgencydirectly. - Branching example — an if/else node reads
nextBestAction.executionHint.typeand routes:pricing-update→ call your Apify pricing-update tool withexecutionHint.suggestedValue(the cohort-median price) onexecutionHint.targetActorIdinvestigate-regression→ create a Linear ticket usingnextBestAction.howToFix[]as the ticket stepsarchive-actor→ open a cleanup PR —nextBestAction.timeToImpact = immediatefor actors with zero runs in 30 daysbuild-new-actor→ seed a planning doc withnextBestAction.shortReasonas the briefinvestigate-cost/investigate-quality/investigate-compliance→ route to your engineering ops triage queue
- Branch on the bucket when you want the broader lane, not the specific fix:
agentContract.bucket == fixNow→ urgent queue;optimizeNext→ this-week backlog;buildNext→ roadmap;considerArchiving→ cleanup. Pair withagentContract.urgency(critical/high/medium/low) for the priority tier. - Structured action arrays are usable verbatim — no LLM rewriting:
decisionCards[](each card hasemoji/title/shortReason/impact/confidence/effort/urgency, Block-Kit-ready for Slack/Teams),actionPlan.fixNow[]/optimizeNext[]/buildNext[](each item carrieshowToFix[]+executionHint), andnextBestAction.howToFix[](paste straight into a ticket body). - Opt-in modes a Dify workflow can leverage (all set on the input node, no extra calls):
mode:default/growth/cost/stability/weekly— reweights the action plan for the lens your workflow cares aboutincludeRevenueBreakdown: true— attaches the per-actorrevenueBreakdownso a node can route on pricing outliers directlyincludeSpecialistReports: true— runs the 5 fleet-wide specialists for the deep composite plan (adds 3-10 min; gate this branch behind a scheduled/async path, not an interactive one)outputProfile:automationstrips the run toagentContract+nextBestAction+ fleet-health headline for a lean one-object branch;executivereturns theoperatorBrieffor a 30-second read;fullkeeps the complete tree
- Closed-loop monitoring is automatic — no input flag needed. From the second scheduled run onward the actor reads its own prior KV snapshot and populates
sinceLastRun(what moved) andoutcomeTracking(did last run'snextBestActionactually land:confirmed/overperformed/partial/underperformed/regressed/insufficient-data). A Dify branch onoutcomeTracking.records[].statusescalates when recommendations are systematically over-promising.
The agentContract flat surface + nextBestAction.howToFix[] + executionHint.consolePath deep-link make this a one-call source for "what's the most leveraged thing to do across my Apify fleet right now, and how do I do it?".
Regression of what?
Several actors in this fleet use the word "regression," each scoped to a different layer. They are not the same check, and running four of them for one job is wasted spend. Here is what each one watches:
| Actor | "Regression" means |
|---|---|
| Input Guard | Input contract — an input that used to validate now fails the target's input_schema.json |
| Deploy Guard | Release behavior — a build that now fails test cases it previously passed |
| Output Guard | Production dataset — completed output that drifted from baseline (null spikes, type drift, coverage drops) |
| Quality Monitor | Metadata / Store readiness — a listing that lost quality points between audits |
| Fleet Health Report | Revenue / business outcome — an actor whose real per-run profit fell off a cliff |
This actor is the Fleet Health Report row: it catches revenue / business-outcome regressions only. For the other layers, use the sibling named in the table.
What this does NOT do
Honest positioning matters more than inflated claims:
- Does not forecast future revenue. Trend detection is snapshot-over-snapshot comparison, not time-series ML. Useful for catching cliffs, not for predicting next month's number.
- Does not auto-execute fixes. You acknowledge items; you implement the changes. A backend actor that auto-edits other actors' configs is a security risk we don't take.
- Does not replace Apify's billing dashboard. Profit numbers are estimates derived from sampled runs + pricing configs. Use them as a portfolio-level indicator, not a substitute for your official billing.
- Does not see multi-account fleets in one run. Analyzes one Apify account per run. Multi-account analysis = multiple runs with different tokens.
- Does not replace Datadog/Grafana/PagerDuty. It fills the Apify-specific gap those platforms don't cover; it isn't a general-purpose observability stack.
When you should NOT use this
This actor is not useful if:
- You have only 1–2 actors and you already know exactly what to fix (the tool is overkill)
- Your actors have no meaningful traffic or revenue yet — there's nothing for the decision engine to rank
- You're looking for long-term forecasting or market prediction — this tool measures, doesn't predict
- You want fully automatic execution of changes without human review — the design deliberately keeps a human in the loop (see "Does not auto-execute fixes" above)
- You're running a purely experimental / hobby portfolio where nothing earns money — the revenue-grounding math has nothing to work with
This actor is designed for portfolios where:
- multiple actors compete for your attention
- prioritization is the actual bottleneck (not building, not debugging)
- small decisions compound into meaningful revenue differences
- you want a system that remembers what you did last week and tells you whether it worked
- you want AI agents or automation to consume the output as a ranked action queue
If you're outside that fit, use the free Apify Console directly — it's enough.
Pricing
Pay-per-event at $1.00 per fleet analysis. Each run produces one consolidated decision engine output — next best action, decision cards, revenue opportunities, outcome tracking, calibration, strategy summary — so one event charge covers the full report, not per-field billing.
| Scenario | Events/mo | Cost |
|---|---|---|
| Weekly strategy review | 4 | $4 |
| Daily monitoring | 30 | $30 |
| Multiple-times-per-day enterprise ops | 90 | $90 |
Standard Apify platform compute costs apply in addition to the PPE charge and are typically under $0.01 per run. A typical 200-actor analysis uses 256 MB and completes in under 2 minutes; includeSpecialistReports mode orchestrates 5 parallel specialists and may use more memory for 3–10 minutes.
Why this price: the output is a decision, not a dashboard, and a single acted-on recommendation pays back weeks of daily runs. The math of one common finding, illustratively:
Finds:      lead-enricher priced at $0.05/event, 30% below your category cohort
Suggests:   raise to the cohort median ($0.10), 3,200 external runs/mo
Uplift:     (0.10 − 0.05) × 3,200 ≈ +$160/mo recovered net profit
This run:   $1.00
That is one pricing outlier. A run also stacks unmonetized-traffic and silent-regression recovery on top, and outcomeTracking then verifies next run whether the change actually landed. (The actor also corrects misattributed revenue — one field test surfaced a $297/mo earner that legacy dashboards showed as $10/mo.)
Programmatic access
Python
from apify_client import ApifyClient

client = ApifyClient("apify_api_YOUR_TOKEN")
run = client.actor("ryanclinton/actor-fleet-analytics").call(
    run_input={
        "apifyToken": "apify_api_YOUR_TOKEN",
        "mode": "growth",
        "includeRevenueBreakdown": True,
    }
)
report = client.dataset(run["defaultDatasetId"]).list_items().items[0]

print(f"Next best action: {report['nextBestAction']['title']}")
print(f"Impact: ${report['nextBestAction']['estimatedImpactMonthlyUsd']}/mo")
print(f"Total revenue uplift available: ${report['revenueOpportunities']['totalMonthlyUpliftUsd']}/mo")
print(f"Fleet health: {report['fleetHealthScore']['score']}/100 ({report['fleetHealthScore']['band']})")
JavaScript
import { ApifyClient } from "apify-client";

const client = new ApifyClient({ token: "apify_api_YOUR_TOKEN" });
const run = await client.actor("ryanclinton/actor-fleet-analytics").call({
    apifyToken: "apify_api_YOUR_TOKEN",
    mode: "growth",
    includeRevenueBreakdown: true,
});
const [report] = (await client.dataset(run.defaultDatasetId).listItems()).items;

console.log(`Next best action: ${report.nextBestAction.title}`);
console.log(`Impact: $${report.nextBestAction.estimatedImpactMonthlyUsd}/mo`);
console.log(`Revenue uplift available: $${report.revenueOpportunities.totalMonthlyUpliftUsd}/mo`);
console.log(`Fleet health: ${report.fleetHealthScore.score}/100 (${report.fleetHealthScore.band})`);
cURL
# Start the run
curl -X POST "https://api.apify.com/v2/acts/ryanclinton~actor-fleet-analytics/runs?token=YOUR_API_TOKEN" \
    -H "Content-Type: application/json" \
    -d '{"mode": "growth", "includeRevenueBreakdown": true}'

# Fetch results
curl "https://api.apify.com/v2/datasets/DATASET_ID/items?token=YOUR_API_TOKEN"
Frequently asked questions
Is this an analytics tool or a monitoring tool? Neither. It's a decision engine for Apify portfolios — it ranks actions, tracks whether they worked, and learns which types of fixes are reliable in your fleet. Analytics and monitoring tools show you data and leave the decisions to you. This one delivers decisions backed by data, with a feedback loop that confirms whether the decisions actually paid back.
How long does a run take?
20–60 seconds for a 200–400 actor fleet in fast mode. includeSpecialistReports adds 3–10 minutes while 5 specialists run in parallel. Comfortably within the 10-minute actor timeout.
Is my API token stored?
No. The token is used only during the run to make authenticated API calls. It is never logged (marked isSecret so Apify redacts it automatically), stored, or transmitted to any third party.
Why is my first run so quiet on trends and resolved items?
Because trend tracking requires a prior snapshot. First run establishes the baseline. From the second run onward, perActorTrends, actionPlan.resolved[], and fleetHealthScore.change all populate automatically.
What's the difference between estimatedMonthlyRevenue and revenueBreakdown.totalActualGrossRevenue30d?
estimatedMonthlyRevenue is net profit after Apify margin and creator-paid compute cost — what you actually bank. totalActualGrossRevenue30d is gross before margin. The two numbers differ by the margin percentage and the compute cost share.
Can I use this with a free Apify account? Yes. The actor works with any account that has a valid API token. Free accounts may have fewer actors and lower API rate limits, which just means the run completes faster.
How does the silent regression detector decide what's a regression?
Three thresholds, all tuned to sit below the main >10% fail alert: runs drop >30% (revenue cliff), net profit drop >20% (revenue cliff), success rate drop >5pp (quality bleed), or success rate drop >3pp (silent regression). The full classification is in the perActorTrends.trends[] output.
When does outcomeTracking start populating?
From the third run onward. It needs two things: the action plan snapshot from the previous run (which contains the target actor ID and expected impact) AND the per-actor profit snapshot from the previous run (which provides the baseline to compute the actual delta). Both are established in run 2, so run 3 is the first run that can correlate. On runs 1 and 2 the field is simply absent.
How is priorityScore in revenueOpportunities computed?
Weighted composite: roi × 50 + effort × 25 + confidence × 25, all on a 0–1 scale. roi is the opportunity's estimatedMonthlyUpliftUsd divided by the biggest uplift in the set. effort is inverted so low effort = high value (low=0.85, medium=0.5, high=0.2). confidence maps the tag directly (high=0.9, medium=0.6, low=0.3). The list is pre-sorted by priorityScore so the first entry is genuinely the one to do first, not just the biggest headline.
What's the difference between outcomeTracking and the action plan's resolved[] array?
resolved[] lists items that disappeared since last run with their original impact estimate — "how much the plan said this was worth." outcomeTracking goes further: for each resolved item with a target actor, it looks up the actual profit delta on that actor and tells you whether the expected impact actually materialized. resolved[] is "what was expected"; outcomeTracking is "what actually happened."
How does the calibration layer learn?
Every outcome record with a definitive status (confirmed, overperformed, partial, underperformed, regressed) is appended to a rolling 500-record KV store grouped by action type. On each run, the stats are recomputed from the full history: accuracy as 1 − mean(|expected − actual| / expected) clamped to [0,1], confirmationRate as the fraction of records hitting confirmed/overperformed. The calibratedConfidence shown on nextBestAction is the harmonic mean of accuracy and confirmation rate — both signals must be healthy for the action type to earn trust. Cold start takes 3 samples per action type (MIN_CALIBRATION_SAMPLES); before that, calibratedConfidence stays null and the raw confidence tag continues to be used. All pure synthesis of existing data — no ML, no forecasting, no external APIs.
The core loop, again — because it's the whole point
Every feature in this actor — calibration, outcome tracking, learning insights, strategy summary, decision cards, the entire presentation layer — exists to make one behaviour trivial:
Open the run, read one field, do one thing. Re-run tomorrow.
That loop is the product. Schedule the actor, read nextBestAction each morning, follow the howToFix[] steps, and let outcomeTracking + calibration confirm whether the fix paid back. Every other field is supporting context for that single decision.
Integration with ApifyForge dashboard
This actor is one of the data sources that powers the ApifyForge dashboard. When connected to your ApifyForge account, fleet analytics data is visualized with trend charts, actor rankings, revenue projections, and health indicators. Schedule this actor to run daily and the dashboard will show historical trends, letting you track growth and spot issues before they become problems.
Next stage
Fleet Health Report is the portfolio stage of one developer lifecycle: publish, quality, release, invocation, orchestration, runtime, migration, portfolio. It is the capstone. It synthesizes signals from the other seven actors into one ranked nextBestAction, and that action points you back to whichever stage matters most right now: Compliance Scanner to publish, Quality Monitor to improve a listing, Deploy Guard to gate a release, Input Guard to fix an invocation, Pipeline Preflight to fix a pipeline, Output Guard to watch production, or A/B Tester to decide a migration.
Related articles
The Apify Actor Execution Lifecycle: 8 Decision Engines
8 backend actors that cover every stage of the Apify actor execution lifecycle. Each returns one decision enum your CI, agent, or webhook can branch on.
How to Audit All Your Apify Actors in One Run (And Know Exactly What to Fix Next)
Audit every Apify actor in one run across 8 quality dimensions. Get a 0-100 score, ordered fix plan, and regression alerts — $0.15 per actor.
Managing an Apify Actor Portfolio: What Actually Works
A practical playbook for running an Apify actor portfolio — the automation, tooling, and feedback-loop system that close the gap between 'what should I fix?' and 'did my last fix actually work?'
Related actors
AI Cold Email Writer — $0.01/Email, Zero LLM Markup
Generates personalized cold emails from enriched lead data using your own OpenAI or Anthropic key. Subject line, body, CTA, and optional follow-up sequence — $0.01/email, zero LLM markup.
AI Outreach Personalizer — Emails with Your LLM Key
Generate personalized cold emails using your own OpenAI or Anthropic API key. Subject lines, opening lines, full bodies — tailored to each lead's role, company, and signals. $0.01/lead compute + your LLM costs. Zero AI markup.
Bulk Email Verifier — MX, SMTP & Disposable Detection at Scale
Verify email deliverability in bulk — MX records, SMTP mailbox checks, disposable detection (55K+ domains), role-based flagging, catch-all detection, domain health scoring (SPF/DKIM/DMARC), and confidence scores. $0.005/email, no subscription.
CFPB Complaint Intelligence — Vendor Risk & Screening
Turn 5M+ CFPB consumer complaints into decisions: screen companies pass / review / fail, score complaint-handling risk, monitor what changed since last run, benchmark cohorts, and build audit-ready due-diligence packs. Filter by company, product, state, and date. No API key.
Ready to try Fleet Health Report — Consolidated Fleet Intelligence?
This actor is coming soon to the Apify Store.
Coming soon