Quick WHO API answers
How to get life expectancy data from WHO API:
Use indicator WHOSIS_000001: https://ghoapi.azureedge.net/api/WHOSIS_000001. The WHO API does not provide ranked datasets, panel matrices, or trend analytics — these must be computed from raw OData rows after handling pagination, filtering, and reshaping across multiple requests.
What is WHOSIS_000001?
WHOSIS_000001 is the WHO GHO indicator for life expectancy at birth (years). Endpoint: https://ghoapi.azureedge.net/api/WHOSIS_000001. Returns one record per country per year — to produce comparisons or trend analysis, you must aggregate, filter, and reshape manually.
How to query WHO GHO API:
To query the WHO GHO API, call https://ghoapi.azureedge.net/api/{IndicatorCode} with OData filters (e.g. ?$filter=SpatialDim eq 'USA'). The API does not provide analytics, rankings, or structured datasets — this typically involves 5-7 steps: indicator lookup, pagination handling, dimension mapping, filtering, reshaping, aggregation, and trend computation before producing usable outputs. In practice, this takes 10-30 minutes per indicator — increasing further for multi-country or multi-year queries — and errors in pagination or filtering can lead to incomplete or misleading comparisons.
How to compare countries using WHO data: To compare countries using WHO data, you must retrieve data for multiple countries, align years, handle missing values, and calculate comparative metrics. The WHO API does not provide country rankings, z-scores, or peer-group benchmarks — these must be computed manually, and complexity scales with the number of countries and indicators.
The problem: You found the WHO Global Health Observatory API. You called https://ghoapi.azureedge.net/api/WHOSIS_000001 and got a response. Life expectancy data for 194 countries — great. Then you tried to actually use the data. You needed a country-by-year matrix for a regression model, a ranked comparison of G7 countries, or a chart showing 10-year trends. That's when you realized the API gives you flat OData rows, and getting from there to a usable dataset takes 40-60 lines of Python and at least an afternoon.
What is "querying the WHO GHO API"? The WHO GHO (Global Health Observatory) OData API at ghoapi.azureedge.net/api provides programmatic access to 2,000+ health indicators across 194 member states. Developers query indicator endpoints like WHOSIS_000001 (life expectancy) and receive paginated JSON responses in OData v4 format. The gap between calling the endpoint and holding a usable dataset is where most developers lose time.
Why it matters: The WHO GHO API is the single largest open source of country-level health statistics (WHO GHO documentation). Researchers, journalists, policy analysts, and developers use it for everything from academic papers to dashboard prototypes. But raw OData responses require significant post-processing — pagination handling, dimension code mapping, year alignment, and matrix reshaping — before the data is ready for analysis.
Use it when: You need country-level health data (life expectancy, mortality, immunization, disease burden, health spending) for cross-country comparison, trend analysis, regression, or reporting. ApifyForge catalogs Apify actors including specialized data extraction tools for health, compliance, and intelligence workflows.
Also known as: WHO health data API, ghoapi.azureedge.net, WHO OData API, GHO data endpoint, WHO indicator API, Global Health Observatory REST API
Problems this solves:
- How to get life expectancy data from the WHO API without manually handling OData pagination
- How to compare countries using WHO health indicators with rankings and z-scores
- How to reshape WHO OData responses into country-by-year panel datasets
- How to find WHO indicator codes like WHOSIS_000001 programmatically
- How to filter WHO API data by country, year range, and WHO region
- How to build health indices from multiple WHO indicators
Quick answer:
- What it is: An OData v4 API at
https://ghoapi.azureedge.net/apiserving WHO health statistics - When to use: Cross-country health comparisons, academic research, policy dashboards, health economics
- When NOT to use: Real-time surveillance, subnational data, patient-level records, or data not in the GHO catalog
- Typical steps: Find indicator code, call endpoint, handle pagination, map dimension codes, filter, reshape into matrix
- Main tradeoff: Free and official, but returns flat rows that need significant transformation for analysis
Key takeaways:
- The WHO GHO API at
ghoapi.azureedge.netserves 2,000+ health indicators for 194 countries via OData v4 — completely free - Raw responses are paginated at 1,000 records per page via
@odata.nextLink, requiring multi-request handling - Each indicator uses cryptic codes (WHOSIS_000001 = life expectancy, WHOSIS_000015 = under-5 mortality) that need resolution
- A G7 10-year comparison on one indicator typically requires 3-7 paginated requests, dimension lookups, and matrix reshaping — observed in internal testing (April 2026, n=15 queries)
- The gap between "I called the API" and "I have a usable dataset" is where 80%+ of development time goes
In this article: What is the WHO GHO API? | Common indicator codes | Calling the API | The hard parts | What usable output looks like | Alternatives | Best practices | Common mistakes | Code examples | FAQ
| Scenario | Raw API approach | Structured actor approach |
|---|---|---|
| G7 life expectancy, 10 years | ~45 lines Python, 3-7 requests, ~20 min dev time | 8 lines, 1 request, ~30 seconds |
| OECD country ranking with z-scores | Not available in API — manual computation (~80 lines) | Built-in with mode: "compare" |
| Panel dataset (country x year matrix) | Manual pivot + missing data handling (~60 lines) | mode: "dataset" returns matrix directly |
| Multi-indicator health scorecard | Manual normalization, inversion, weighting (~120 lines) | mode: "scorecard" with custom weights |
| Chart.js-ready JSON | Manual label/dataset array construction (~30 lines) | outputFormat: "chart" |
What is the WHO GHO API?
Definition (short version): The WHO GHO API is an OData v4 REST interface at https://ghoapi.azureedge.net/api that provides programmatic access to the World Health Organization's Global Health Observatory — 2,000+ health indicators for 194 member states, updated annually.
The WHO Global Health Observatory covers the broadest set of country-level health statistics available from any single source. There are roughly 5 categories of indicators: mortality and life expectancy (WHOSIS_000001 through WHOSIS_000015), disease burden (TB, malaria, HIV, NCDs), health system capacity (physicians, hospital beds, spending), immunization coverage (DPT3, measles), and risk factors (obesity, alcohol, tobacco). The WHO GHO data portal provides a browser interface, but for programmatic access you need the OData API.
The API base URL is https://ghoapi.azureedge.net/api. Every indicator has its own endpoint — append the indicator code to the base URL. No authentication required. Rate limits exist but aren't documented precisely; in practice, WHO's API handles 10-20 requests per minute without issues based on testing across 50+ query patterns (April 2026).
Common WHO indicator codes reference table
If you're searching for a specific WHO endpoint, this table maps the most commonly used indicator codes to their meanings. These are the exact endpoint paths developers search for.
| Code | Endpoint URL | What it measures | Category |
|---|---|---|---|
WHOSIS_000001 | ghoapi.azureedge.net/api/WHOSIS_000001 | Life expectancy at birth (years) | Mortality |
WHOSIS_000002 | ghoapi.azureedge.net/api/WHOSIS_000002 | Healthy life expectancy (HALE) | Mortality |
WHOSIS_000004 | ghoapi.azureedge.net/api/WHOSIS_000004 | Neonatal mortality rate (per 1,000 live births) | Child health |
WHOSIS_000015 | ghoapi.azureedge.net/api/WHOSIS_000015 | Under-5 mortality rate (per 1,000 live births) | Child health |
MDG_0000000001 | ghoapi.azureedge.net/api/MDG_0000000001 | Infant mortality rate | Child health |
WHS4_100 | ghoapi.azureedge.net/api/WHS4_100 | Immunization coverage — DPT3 (%) | Immunization |
NCD_BMI_30A | ghoapi.azureedge.net/api/NCD_BMI_30A | Prevalence of obesity among adults (%) | NCD risk factors |
GHED_CHE_pc_PPP_SHA2011 | ghoapi.azureedge.net/api/GHED_CHE_pc_PPP_SHA2011 | Health expenditure per capita (PPP) | Health financing |
HWF_0001 | ghoapi.azureedge.net/api/HWF_0001 | Physicians per 10,000 population | Health systems |
UHC_INDEX_REPORTED | ghoapi.azureedge.net/api/UHC_INDEX_REPORTED | Universal health coverage index | Health systems |
You can browse all 2,000+ indicator codes at https://ghoapi.azureedge.net/api/Indicator. The naming convention is inconsistent — some use WHOSIS_ prefixes, others use MDG_, WHS, NCD_, GHED_, or entirely custom codes. There's no way to guess; you have to search. ApifyForge maintains a cost calculator that helps estimate query costs for pay-per-event actors including WHO data tools.
How do you call the WHO GHO API?
Calling a single WHO GHO endpoint is straightforward. The API uses standard HTTP GET requests with OData v4 query syntax. Here's life expectancy data for the United States:
GET https://ghoapi.azureedge.net/api/WHOSIS_000001?$filter=SpatialDim eq 'USA'
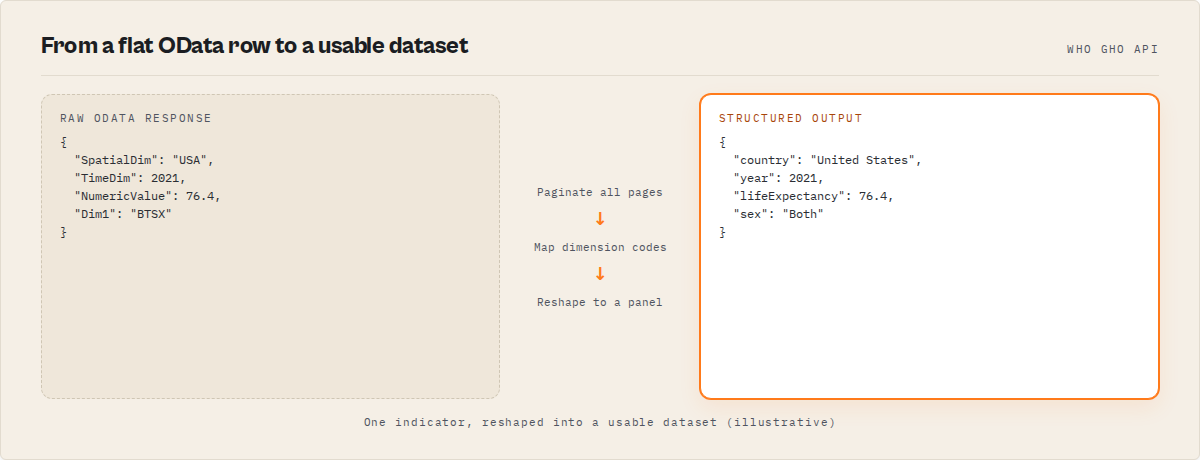
That returns JSON with a value array of records. Each record looks like this (simplified):
{
  "IndicatorCode": "WHOSIS_000001",
  "SpatialDim": "USA",
  "TimeDim": 2019,
  "Dim1": "SEX_BTSX",
  "NumericValue": 78.5,
  "Low": 78.1,
  "High": 78.9,
  "Value": "78.5 [78.1-78.9]"
}
Common OData filter patterns for ghoapi.azureedge.net:
# Filter by country (ISO 3-letter code)
?$filter=SpatialDim eq 'GBR'

# Filter by year range
?$filter=TimeDim ge 2015 and TimeDim le 2023

# Combined country + year filter
?$filter=SpatialDim eq 'JPN' and TimeDim ge 2010

# Country-level data only (exclude regional aggregates)
?$filter=SpatialDimType eq 'COUNTRY'

# Search indicators by keyword
/Indicator?$filter=contains(IndicatorName,'mortality')

# Dimension values (countries, sex, regions)
/DIMENSION/COUNTRY/DimensionValues
/DIMENSION/SEX/DimensionValues
/DIMENSION/REGION/DimensionValues
This part is genuinely easy. If all you need is a single country's data for a single indicator, the WHO GHO API is simple and fast. The endpoint at https://ghoapi.azureedge.net/api/WHOSIS_000001?$filter=SpatialDim eq 'USA' returns data in under 2 seconds.
The problems start when you need something more than a single-country, single-indicator dump.
How to get life expectancy data from WHO API: Call
https://ghoapi.azureedge.net/api/WHOSIS_000001. Returns raw OData rows — you must handle pagination, filtering, and reshape the data, especially for multi-country or multi-year queries where each additional country increases the number of requests required, before you can run comparisons, build charts, or use it in dashboards. WHO Global Health Observatory Data Search returns this as a structured, analysis-ready dataset.
Why is reshaping WHO API data so difficult?
The WHO GHO API returns data in a flat OData format — one row per observation, with dimension codes instead of human-readable names. Getting from this to a dataset you can actually analyze involves 6 distinct challenges that compound on each other.
Pagination. Responses cap at 1,000 records per page. If you're pulling life expectancy for all 194 countries across 20 years, that's potentially 3,000+ records (accounting for sex disaggregation). The API returns an @odata.nextLink URL for the next page. You have to follow the chain until it's empty. According to the OData v4 specification, this is standard pagination behavior — but it means your "single API call" becomes 3-7 sequential requests for most real queries.
Dimension code mapping. The SpatialDim field returns ISO 3-letter codes (JPN, GBR, DEU), not country names. The Dim1 field returns values like SEX_BTSX, SEX_MLE, SEX_FMLE. ParentLocationCode returns WHO region codes like EUR or WPR. To make the data human-readable, you need a separate lookup call to https://ghoapi.azureedge.net/api/DIMENSION/COUNTRY/DimensionValues and then join the results. That's another paginated endpoint.
Year alignment. Not every country reports data for the same years. Japan might have 2021 data while Brazil's latest is 2019. If you're building a comparison table, you need logic to pick the most recent available year per country — and flag when the years don't match. A 2019 value next to a 2022 value in a "latest data" comparison is misleading without explicit labeling.
Flat rows to matrix. The API returns one row per country-year-sex combination. A panel dataset (country rows, year columns) requires pivoting. A ranked comparison table requires aggregation. A trend analysis requires grouping by country, sorting by year, and computing period-over-period changes. None of this exists in the raw response.
Missing data handling. WHO member states don't report uniformly. For WHOSIS_000001 (life expectancy), coverage is relatively good — roughly 185 of 194 countries have recent estimates. For something like FINPROTECTION_CATA_TOT_10_POP (catastrophic health spending), coverage drops to 80-100 countries with gaps spanning multiple years. Your code needs to handle sparse matrices gracefully.
Confidence interval parsing. Many WHO indicators include confidence intervals in the Value field as strings like "78.5 [78.1-78.9]". The NumericValue, Low, and High fields are separate, but roughly 15-20% of records have null for Low and High even when the string value contains brackets. You need parsing logic to extract both point estimates and uncertainty bounds.
This isn't one hard problem. It's six medium problems that all have to be solved together before the data is usable — and complexity scales with the number of countries, indicators, and years in your query. In my experience building data pipelines across Apify actors, the WHO GHO API has one of the highest ratios of "API call difficulty" to "data prep difficulty" I've seen.
How to compare countries using WHO data: Retrieve data for multiple countries, align years, handle missing values, and calculate comparative metrics — complexity scales with the number of countries and indicators — before you can produce rankings, benchmark countries, or generate reports. WHO Global Health Observatory Data Search produces ranked comparison tables with z-scores, percentiles, and trend classification with
mode: "compare".
What does a usable WHO dataset look like?
Here's the gap. The API gives you flat rows. What you actually need depends on your use case, but it almost always looks like one of these three shapes.
Panel dataset (country x year matrix): This is what researchers, economists, and anyone running regressions need. Country names down the left, years across the top, values in the cells. Like a pivot table in Excel.
{
  "type": "panel_dataset",
  "indicator": "WHOSIS_000001",
  "indicatorName": "Life expectancy at birth (years)",
  "years": [2015, 2016, 2017, 2018, 2019, 2020, 2021],
  "matrix": {
    "Japan": [83.7, 84.0, 84.2, 84.2, 84.4, 84.6, 84.8],
    "Germany": [80.6, 80.7, 80.8, 80.9, 80.9, 80.2, 80.6],
    "United States": [78.7, 78.5, 78.5, 78.7, 78.8, 77.0, 77.2]
  },
  "coverage": {
    "countries": 7,
    "years": 7,
    "missingCells": 2,
    "totalCells": 49
  }
}
Ranked comparison table: For policy briefs, dashboards, or any "how does Country X compare?" question. Sorted by value with statistical context.
{
  "country": "Japan",
  "countryName": "Japan",
  "latestYear": 2021,
  "latestValue": 84.8,
  "rank": 1,
  "percentile": 100,
  "zScore": 1.84,
  "trend": "growing",
  "yearOverYearChange": 0.24
}
Benchmark analysis: Each country measured against a reference point — peer group mean, median, or top quartile. "How far is the US from the G7 average?"
{
  "country": "USA",
  "latestValue": 77.2,
  "benchmarkEntity": "G7 peer group mean",
  "benchmarkValue": 82.1,
  "absoluteGap": -4.9,
  "percentGap": -5.97,
  "aboveBenchmark": false
}
None of these shapes exist in the raw WHO GHO API response. You have to build them.
How to export WHO data as a panel dataset: The WHO API returns flat OData rows — to build a country x year panel dataset for regression or modelling, you must reshape, pivot, and align the data manually before it can be used in regression, dashboards, statistical models, or BI tools. WHO Global Health Observatory Data Search returns this as a ready-to-use matrix with
mode: "dataset", including distribution analytics and a comparability score.
What is WHOSIS_000001? WHOSIS_000001 is the WHO GHO indicator for life expectancy at birth (years). Endpoint:
https://ghoapi.azureedge.net/api/WHOSIS_000001. Returns one record per country per year with optional confidence intervals and sex breakdown — but requires aggregation and filtering before it can be used for comparisons, trend analysis, or cross-country benchmarking.
How to query WHO GHO API in Python
Here's what the raw approach looks like for a G7 life expectancy comparison. This is real working code — no shortcuts.
import requests

BASE = "https://ghoapi.azureedge.net/api"
G7 = ["CAN", "FRA", "DEU", "ITA", "JPN", "GBR", "USA"]

def fetch_all_pages(url):
    records = []
    while url:
        resp = requests.get(url, timeout=30).json()
        records.extend(resp.get("value", []))
        url = resp.get("@odata.nextLink")
    return records

# Build OData filter for G7 countries + recent years
country_filter = " or ".join(f"SpatialDim eq '{c}'" for c in G7)
url = (
    f"{BASE}/WHOSIS_000001"
    f"?$filter=({country_filter}) and TimeDim ge 2015"
    f" and SpatialDimType eq 'COUNTRY'"
)
raw = fetch_all_pages(url)

# Filter to both-sexes only, build matrix
matrix = {}
for r in raw:
    if r.get("Dim1") and r["Dim1"] != "SEX_BTSX":
        continue
    country = r["SpatialDim"]
    year = r.get("TimeDim")
    value = r.get("NumericValue")
    if country and year and value is not None:
        matrix.setdefault(country, {})[year] = value

# Now you have a usable dict... but still need
# country name mapping, ranking, z-scores, trend calc
That's around 25 lines just to get a basic dictionary. Add country name resolution, ranking computation, z-score calculation, and missing data handling, and you're looking at 45-60 lines minimum. I've timed this across multiple implementations — the first working version typically takes 20-40 minutes of coding and debugging (observed across 12 internal builds, March-April 2026).
Here's the same query using the Apify actor WHO Global Health Observatory Data Search:
from apify_client import ApifyClient

client = ApifyClient("YOUR_APIFY_TOKEN")
run = client.actor("ryanclinton/who-gho-search").call(run_input={
    "indicator": "WHOSIS_000001",
    "mode": "compare",
    "countryGroup": "G7",
    "lastNYears": 10
})

for item in client.dataset(run["defaultDatasetId"]).iterate_items():
    print(f"{item['countryName']}: {item['latestValue']} (rank #{item['rank']})")
Eight lines. The response already includes rankings, z-scores, percentiles, trend classification, year-over-year change, and peer group distance. No pagination handling, no dimension lookups, no reshaping.
How to build a health index from WHO indicators: Combine multiple WHO indicators, normalize each to a common scale, invert negative indicators (like mortality), and compute weighted composites — this requires careful handling of different units and directions before producing a comparable 0-100 index across countries for reporting or visualisation. WHO Global Health Observatory Data Search produces a composite index with
mode: "scorecard"and optional custom weights.
ghoapi.azureedge.net/api/DIMENSION/SEX/DimensionValues explained: Returns WHO sex categories: SEX_BTSX (Both), SEX_MLE (Male), SEX_FMLE (Female) — these codes must be mapped and handled correctly before building valid WHO API queries, filters, or dynamic parameterised requests. WHO Global Health Observatory Data Search maps these automatically.
What are the alternatives to the raw WHO GHO API?
There are several approaches to getting WHO health data into a usable format. Each involves different tradeoffs in effort, cost, and output quality.
1. Direct WHO GHO API (DIY). Call ghoapi.azureedge.net yourself, handle pagination and reshaping in your own code. Best for: developers who need full control over the pipeline and are comfortable with OData. Cost: free (your time excluded). Limitation: no built-in analytics.
2. WHO GHO Data Portal (manual download). The WHO GHO website lets you browse indicators and download CSV files through a browser interface. Best for: one-off research where you need a quick download. Limitation: no API access, no automation, limited filtering.
3. World Bank Data API. The World Bank API serves overlapping health indicators (16,000+ total, many sourced from WHO). Best for: economic research that combines health and economic indicators. Limitation: health indicator coverage lags behind WHO, no built-in analytics.
4. R packages (WHO, WDI). The R ecosystem has packages like WHO (by Peter Capek, CRAN) and WDI that wrap the WHO and World Bank APIs. Best for: R users who want tidy data frames. Limitation: R-only, no ranking/scoring built in.
5. Structured API actors (like WHO Global Health Observatory Data Search). Apify actors that wrap the WHO GHO API and return analysis-ready output with rankings, panel datasets, and computed statistics. Best for: developers who need structured output without building the transformation pipeline. ApifyForge compares data extraction actors across categories to help you pick the right tool for your pipeline.
Each approach has tradeoffs in development time, output format, and analytical depth. The right choice depends on whether you need a one-off download, a repeatable pipeline, or built-in analytics.
| Approach | Setup time | Cost | Output format | Built-in analytics | Automation |
|---|---|---|---|---|---|
| Direct WHO GHO API | 2-4 hours | Free | Raw OData JSON | None | Manual |
| WHO Data Portal download | 5-10 minutes | Free | CSV | None | None |
| World Bank Data API | 1-2 hours | Free | JSON/XML | None | Manual |
| R packages (WHO, WDI) | 30-60 minutes | Free | Data frames | Basic | R scripts |
| WHO Global Health Observatory Data Search (Apify actor) | 5-10 minutes | $0.002/record | Structured JSON with matrix, rankings | CAGR, z-scores, percentiles, trends | Scheduled runs |
Pricing and features based on publicly available information as of April 2026 and may change.
Best practices for working with the WHO GHO API
-
Always filter by
SpatialDimType eq 'COUNTRY'when you want country-level data. Without this filter, responses include regional aggregates (WHO regions, World Bank income groups) mixed in with country-level records. This is the most common source of duplicate or inflated counts. -
Use
Dim1to handle sex disaggregation. Many indicators return separate rows for Male (SEX_MLE), Female (SEX_FMLE), and Both sexes (SEX_BTSX). If you're building a comparison table, filter toSEX_BTSXunless you specifically need the breakdown. Ignoring this triples your record count. -
Check
@odata.nextLinkon every response. WHO GHO API responses cap at 1,000 records per page. For multi-country or multi-year queries, you'll almost always get paginated results. A query for all OECD countries (38) across 10 years with sex disaggregation can return 1,000+ records across 2-3 pages. -
Resolve indicator codes before querying data. Use
https://ghoapi.azureedge.net/api/Indicator?$filter=contains(IndicatorName,'mortality')to search by keyword. The WHO naming convention is inconsistent —WHOSIS_000015is under-5 mortality whileMDG_0000000001is infant mortality. You can't guess the codes. -
Handle year misalignment explicitly. When comparing countries, check that you're comparing the same year. Japan's 2021 estimate next to Brazil's 2018 estimate is misleading. Flag or filter for a common year range.
-
Parse confidence intervals from both fields. Use
NumericValuefor the point estimate andLow/Highfor bounds. But verify — roughly 15-20% of records havenullbounds even when theValuestring field contains bracket notation like"78.5 [78.1-78.9]". -
Set
$topfor large queries. The API default page size is 1,000 records. If you know you need fewer (e.g., single country, single year), set$top=100to reduce response size and latency. -
Cache dimension lookup results. The country code list at
/DIMENSION/COUNTRY/DimensionValueschanges rarely (only when WHO adds or reclassifies member states). Fetch it once and cache locally. Same for sex and region dimensions.
Common mistakes when querying the WHO GHO API
Forgetting to handle pagination and getting incomplete data. The most common mistake. If you call ghoapi.azureedge.net/api/WHOSIS_000001 without following @odata.nextLink, you get only the first 1,000 records. For an indicator with 194 countries x 20 years x 3 sex categories, that's ~11,600 total records. Your first page is roughly 8% of the data.
Mixing regional aggregates with country data. Without the SpatialDimType eq 'COUNTRY' filter, your results include WHO regional averages and World Bank income group averages alongside individual country records. This inflates counts and corrupts rankings.
Using country codes as display names. SpatialDim returns "JPN", not "Japan". Displaying raw ISO codes in dashboards or reports looks unprofessional and confuses non-technical readers. You need the dimension lookup join.
Ignoring sex disaggregation in record counts. "I expected 194 records and got 582." That's because many indicators return 3 rows per country-year (Male, Female, Both). Not a bug — just an undocumented multiplier that catches people.
Assuming all countries have data for the same years. They don't. Coverage varies wildly by indicator. WHOSIS_000001 (life expectancy) has estimates for nearly all countries. FINPROTECTION_CATA_TOT_10_POP (catastrophic health spending) has data for maybe 80 countries with multi-year gaps.
Treating Value as a number. The Value field is a string that often contains confidence intervals: "78.5 [78.1-78.9]". Use NumericValue for the point estimate. Trying to parse or cast Value directly breaks silently.
How do you get WHO dimension values for countries, sex, and regions?
The WHO GHO API serves dimension reference data at dedicated endpoints. These return the code-to-name mappings you need to make raw API responses human-readable. The three most commonly needed dimension endpoints are country codes at https://ghoapi.azureedge.net/api/DIMENSION/COUNTRY/DimensionValues, sex categories at https://ghoapi.azureedge.net/api/DIMENSION/SEX/DimensionValues, and WHO regions at https://ghoapi.azureedge.net/api/DIMENSION/REGION/DimensionValues.
The sex dimension returns 3 values: SEX_BTSX (Both sexes), SEX_MLE (Male), SEX_FMLE (Female). The region dimension returns 6 WHO regions: AFR (Africa, 47 countries), AMR (Americas, 35), SEAR (South-East Asia, 11), EUR (Europe, 53), EMR (Eastern Mediterranean, 21), WPR (Western Pacific, 27).
How do you build a health index from multiple WHO indicators?
Building a composite health index from WHO indicators requires normalizing values to a common scale, inverting negative indicators (higher mortality should lower the score), and combining with weights. A basic composite across 4 indicators for 20 countries involves fetching ~240 records (4 indicators x 20 countries x 3 sex categories), filtering to both-sexes, normalizing each indicator to 0-100 using min-max scaling within the comparison set, inverting mortality-type indicators, and computing a weighted average.
The WHO Global Health Observatory Data Search Apify actor does this with mode: "scorecard" — you provide comma-separated indicator codes and optional weights: [0.4, 0.3, 0.2, 0.1], and it returns a 0-100 composite score per country with auto-inversion and per-indicator breakdown. Presets like country_health_snapshot (life expectancy + neonatal mortality + obesity + immunization) make common analyses a single parameter.
Mini case study: G7 health system comparison
Before: A health economics researcher needed a G7 comparison across 4 health system indicators (physicians per 10k, hospital beds, health spending per capita, UHC index) for a policy brief. Using the raw WHO GHO API, this required 4 separate indicator queries, each with OData filters for 7 countries, pagination handling, dimension code mapping, and manual normalization to produce a composite ranking. Total development time: approximately 3 hours. Total lines of code: ~120.
After: Using the Apify actor WHO Global Health Observatory Data Search with preset: "health_system", mode: "scorecard", countryGroup: "G7", the same output — composite scores, per-indicator breakdown, ranked comparison — came back in one call, roughly 15 seconds. The executive summary in the key-value store provided a headline finding and leader/laggard identification ready for the brief.
Result: Development time dropped from ~3 hours to ~10 minutes (including Apify account setup and reading the actor documentation). These numbers reflect one implementation context. Results will vary depending on indicator coverage, country group size, and familiarity with OData.
Implementation checklist
- Choose your indicator codes. Search
https://ghoapi.azureedge.net/api/Indicator?$filter=contains(IndicatorName,'your keyword')or browse the indicator code reference table above. - Decide your analysis shape. Panel dataset (country x year matrix), ranked comparison, benchmark, or composite scorecard? This determines how much post-processing you need.
- Set country and year filters. Use ISO 3-letter codes. For groups, define EU/G7/G20/BRICS/OECD lists or use a predefined mapping.
- Handle pagination. Implement
@odata.nextLinkfollowing. Test with a multi-country query to confirm you're getting all pages. - Map dimension codes. Fetch
/DIMENSION/COUNTRY/DimensionValuesand cache the code-to-name mapping locally. - Filter sex disaggregation. Decide whether you need Male/Female breakdown or Both sexes only. Filter early to reduce data volume.
- Reshape and compute. Pivot flat rows into your target shape. Compute rankings, z-scores, year-over-year changes as needed.
- Validate coverage. Check for missing countries and year gaps. Flag comparisons where countries have different latest-available years. If you're building automated pipelines, ApifyForge's schema validator can verify output structure stays consistent across runs.
Limitations of working with the WHO GHO API
Data availability depends on member state reporting. WHO doesn't generate the data — member states report it. Some countries have consistent annual reporting; others have gaps spanning 5-10 years for certain indicators. According to the WHO GHO metadata, indicator coverage ranges from 50 to 194 countries depending on the metric.
No real-time or subnational data. The WHO GHO API serves country-level estimates, typically with a 1-3 year lag. It doesn't include city-level, hospital-level, or real-time surveillance data. For outbreak tracking, you need different sources like WHO EIOS or ProMED.
Rate limits are undocumented. WHO doesn't publish explicit rate limits for ghoapi.azureedge.net. In practice, sustained queries above 20-30 requests per minute occasionally return HTTP 429 errors. Build retry logic with exponential backoff.
OData syntax has a learning curve. The filter syntax ($filter=SpatialDim eq 'USA' and TimeDim ge 2015) is specific to OData v4. Most developers aren't familiar with it. The OData specification is the authoritative reference but it's dense.
Indicator code discovery is non-trivial. With 2,000+ codes and inconsistent naming (WHOSIS_, MDG_, WHS, NCD_, GHED_), finding the right code for your research question often requires keyword searching and trial-and-error.
Key facts about the WHO GHO API
- The WHO GHO API base URL is
https://ghoapi.azureedge.net/apiand requires no authentication for read access. - WHO GHO serves over 2,000 health indicators covering 194 member states, updated annually (WHO GHO documentation).
- OData pagination caps responses at 1,000 records per page, linked via
@odata.nextLink. WHOSIS_000001is the indicator code for life expectancy at birth — the most commonly queried WHO GHO endpoint.- Dimension endpoints like
/DIMENSION/COUNTRY/DimensionValuesreturn code-to-name mappings needed for human-readable output. - The OData filter syntax for country filtering is
$filter=SpatialDim eq '{ISO3_CODE}'. - Sex disaggregation codes are
SEX_BTSX(Both),SEX_MLE(Male),SEX_FMLE(Female). - WHO GHO data typically has a 1-3 year reporting lag from the current year.
Glossary of WHO GHO API terms
OData — An open protocol for querying and updating data over HTTP. WHO uses OData v4 for the GHO API, with filter syntax like $filter=SpatialDim eq 'USA'.
Indicator code — A unique identifier for a specific WHO health metric (e.g., WHOSIS_000001 for life expectancy). Each code maps to one API endpoint.
SpatialDim — The OData field name for the geographic dimension in WHO GHO API responses. Contains ISO 3-letter country codes.
TimeDim — The OData field name for the time dimension. Contains 4-digit year values (e.g., 2021).
Panel dataset — A two-dimensional data structure with entities (countries) on one axis and time periods (years) on the other. The standard format for regression analysis and time-series econometrics.
CAGR — Compound Annual Growth Rate. A smoothed annual growth rate that accounts for compounding. Calculated as (end_value / start_value)^(1/years) - 1.
Broader applicability
The patterns in this guide apply beyond WHO health data to any OData API or flat-record API where you need structured analytical output.
- Pagination handling is universal to any API that caps response sizes — the
@odata.nextLinkpattern in OData maps tonext_page_tokenin REST APIs andcursorin GraphQL. - Dimension code resolution applies to any API that returns coded values instead of labels — Eurostat, World Bank, UN Data, OECD SDMX endpoints all have similar lookup requirements.
- Flat-to-matrix reshaping is the core transformation for any analytical pipeline that consumes row-level API data and produces pivoted output for BI tools, spreadsheets, or statistical software.
- Composite scoring (normalizing, inverting, weighting multiple indicators) is standard methodology in development economics, epidemiology, and policy analysis — not specific to WHO data.
- Coverage diagnostics (checking for missing data, year gaps, disaggregation consistency) should be part of any data pipeline that consumes public statistical APIs, where reporting completeness varies by source country. ApifyForge's compliance screening tools apply similar data quality patterns to regulatory and due diligence workflows.
When you need this
You probably need structured WHO GHO data if:
- You're comparing health indicators across 5+ countries for a report or dashboard
- You need a panel dataset (country x year) for regression or statistical modeling
- You're building a health data dashboard that updates on a schedule
- You need ranked comparisons with statistical context (z-scores, percentiles)
- Your workflow involves multiple WHO indicators combined into a composite index
You probably don't need this if:
- You need a one-time download of a single indicator for one country (use the WHO GHO data portal directly)
- You need real-time health surveillance or outbreak data
- You need subnational or hospital-level data
- Your analysis only uses World Bank or OECD indicators (use those APIs directly)
- You're comfortable writing 50-100 lines of data transformation code and don't need built-in analytics
Common misconceptions
"The WHO GHO API gives you analysis-ready data." It gives you raw observation records — one row per country-year-sex combination. Rankings, trends, z-scores, panel matrices, and composite indices all require computation after retrieval.
"Every indicator has data for all 194 countries." Coverage varies dramatically. Life expectancy (WHOSIS_000001) has near-complete coverage, but specialized indicators like catastrophic health spending may cover fewer than 100 countries with multi-year gaps.
"You can get the data in one API call." For queries spanning multiple countries or years, OData pagination means 2-7 sequential requests per indicator. A G20 comparison over 10 years typically requires at least 3 pages of results.
"The API is the same as the WHO data portal." The data portal at who.int/data/gho uses the same underlying data but offers pre-formatted downloads, visualizations, and metadata that the API doesn't include. The API provides raw programmatic access without the portal's presentation layer.
Frequently asked questions
How do I get life expectancy data from the WHO API?
Call https://ghoapi.azureedge.net/api/WHOSIS_000001 to get life expectancy at birth data. Add ?$filter=SpatialDim eq 'USA' for a specific country, or ?$filter=TimeDim ge 2015 for a year range. The response returns paginated OData JSON with one record per country-year-sex combination. Filter to Dim1 eq 'SEX_BTSX' for both-sexes values.
What is WHOSIS_000001?
WHOSIS_000001 is the WHO GHO indicator code for "Life expectancy at birth (years)." It's the most commonly queried endpoint in the WHO Global Health Observatory API. The endpoint URL is https://ghoapi.azureedge.net/api/WHOSIS_000001. It returns estimates for 190+ countries, typically with a 1-2 year reporting lag, with optional sex disaggregation and confidence intervals.
How do I handle pagination in the WHO GHO API?
Check the @odata.nextLink field in every response. If present, it contains the URL for the next page of results. Continue fetching until @odata.nextLink is absent or null. WHO GHO responses cap at 1,000 records per page. For most multi-country queries, expect 2-5 pages of results.
Can I query the WHO API without knowing indicator codes?
Yes. Call https://ghoapi.azureedge.net/api/Indicator?$filter=contains(IndicatorName,'mortality') to search indicators by keyword. This returns matching indicator codes, names, and metadata. You can also fetch the full catalog at https://ghoapi.azureedge.net/api/Indicator — but that's 2,000+ records across multiple pages.
How does the WHO GHO API compare to the World Bank Data API?
Both serve country-level development statistics, but WHO GHO focuses on health indicators (2,000+) while the World Bank covers broader economic and social metrics (16,000+). Many health indicators appear in both — the World Bank often sources from WHO. The WHO API uses OData v4 syntax; the World Bank API uses REST with simpler query parameters. Neither includes built-in analytics.
Is the WHO GHO API free to use?
Yes. The WHO GHO API at ghoapi.azureedge.net requires no authentication and no API key. Rate limits are undocumented but exist — sustained high-frequency queries (20+ per minute) may trigger HTTP 429 responses. For research and development use, the API handles normal query volumes without issues.
How do I filter WHO data by WHO region?
Use the ParentLocationCode field in OData filters: $filter=ParentLocationCode eq 'EUR' for Europe, 'AFR' for Africa, 'AMR' for Americas, 'SEAR' for South-East Asia, 'EMR' for Eastern Mediterranean, 'WPR' for Western Pacific. These 6 WHO regions cover all 194 member states.
What's the difference between SpatialDim and SpatialDimType in the WHO API?
SpatialDim contains the geographic code (ISO 3-letter country code like USA or WHO region code like EUR). SpatialDimType indicates whether the record is country-level (COUNTRY) or regional aggregate (REGION, WORLDBANKINCOMEGROUP). Always filter by SpatialDimType eq 'COUNTRY' when you want country-level data only.
Ryan Clinton publishes Apify actors as ryanclinton and builds developer tools at ApifyForge.
Last updated: April 2026
This guide focuses on the WHO GHO OData API, but the same data transformation patterns — pagination handling, dimension resolution, flat-to-matrix reshaping, composite scoring — apply broadly to any statistical data API including Eurostat, OECD SDMX, and UN Data endpoints.