By Ryan Clinton · April 2026
Apify Fleet Analytics is an ApifyForge feature for developers running multiple Apify actors on one account. It aggregates actor metadata, run history, and build history into a single dashboard with a Fleet Health Score, cost trends, failure patterns, and a prioritized Action Plan. It is most useful once the per-actor Apify Console stops answering account-wide questions — where spend is drifting, which actors regressed this week, and what should be fixed first. This limitation tends to become obvious once you are managing a larger set of actors on one account, when per-actor views stop answering account-level questions. This is the same architectural direction as our earlier work on the Apify account dashboard, extended with an aggregated health score and action prioritization.
How this guide is verified
- Based on direct use of the Apify REST API endpoints
/v2/acts,/v2/acts/{id}/runs, and/v2/acts/{id}/builds(see the Apify platform documentation). - Reflects the current Fleet Analytics implementation in ApifyForge as of April 2026.
- Security model verified against the Apify scoped-token permission schema — the permission list matches what Apify Console actually exposes in Settings → Integrations → Create new token.
- Architecture described here is inspectable in the ApifyForge codebase (
src/lib/apify/runner.tsfor the dataset-fetching path,src/app/api/settings/token/route.tsfor the token encryption and validation path).
Also known as: Apify fleet dashboard, Apify multi-actor monitoring, Apify actor portfolio view, cross-actor analytics, Apify fleet health monitoring, Apify account-wide observability.
Problems this solves (how-to queries):
- How to monitor multiple Apify actors from a single dashboard
- How to see cost trends across all my Apify actors at once
- How to find idle or stale Apify actors in my account
- How to detect week-over-week regressions across a fleet of scrapers
- How to prioritize which Apify actors to fix, optimize, or archive
- How to get an aggregate health score for an Apify account
Direct answer: how to monitor multiple Apify actors in one dashboard
The simplest way to monitor multiple Apify actors in one dashboard is to use a fleet-level aggregation layer that calls the Apify API across every actor on your account and rolls the results into a single view. This is not supported natively in the Apify Console, which is scoped per actor — there is no account-wide rollup view in the default Console UI, so the aggregation has to happen somewhere else.
Fleet Analytics does this by:
- calling
/v2/acts,/v2/acts/{id}/runs, and/v2/acts/{id}/buildsacross every actor on your account - aggregating runs, cost, and failures into account-level metrics
- rendering a single dashboard with a Fleet Health Score and a prioritized Action Plan
Without this kind of aggregation layer, you would need to combine /v2/acts and the per-actor run and build endpoints yourself — either in a custom script, a generic observability platform like Datadog or Grafana, or a webhook-driven backend.
Quick answer
- What it is: an account-wide dashboard for Apify actors, computed from the Apify API and cached in ApifyForge.
- When to use it: when you manage multiple Apify actors and need aggregate metrics the Console doesn't show.
- When not to use it: if you only run one or two actors — the Console's per-actor view is enough.
- Typical flow: create a scoped Apify API token, paste it into ApifyForge Settings, click Run Fleet Analysis.
- Main tradeoff: Fleet Analytics runs on your own Apify account, so the backend actor execution consumes your Apify credits under Pay-Per-Event pricing.
In this article
What it is · How it works · The trust model · How to try it · FAQ
Key takeaways:
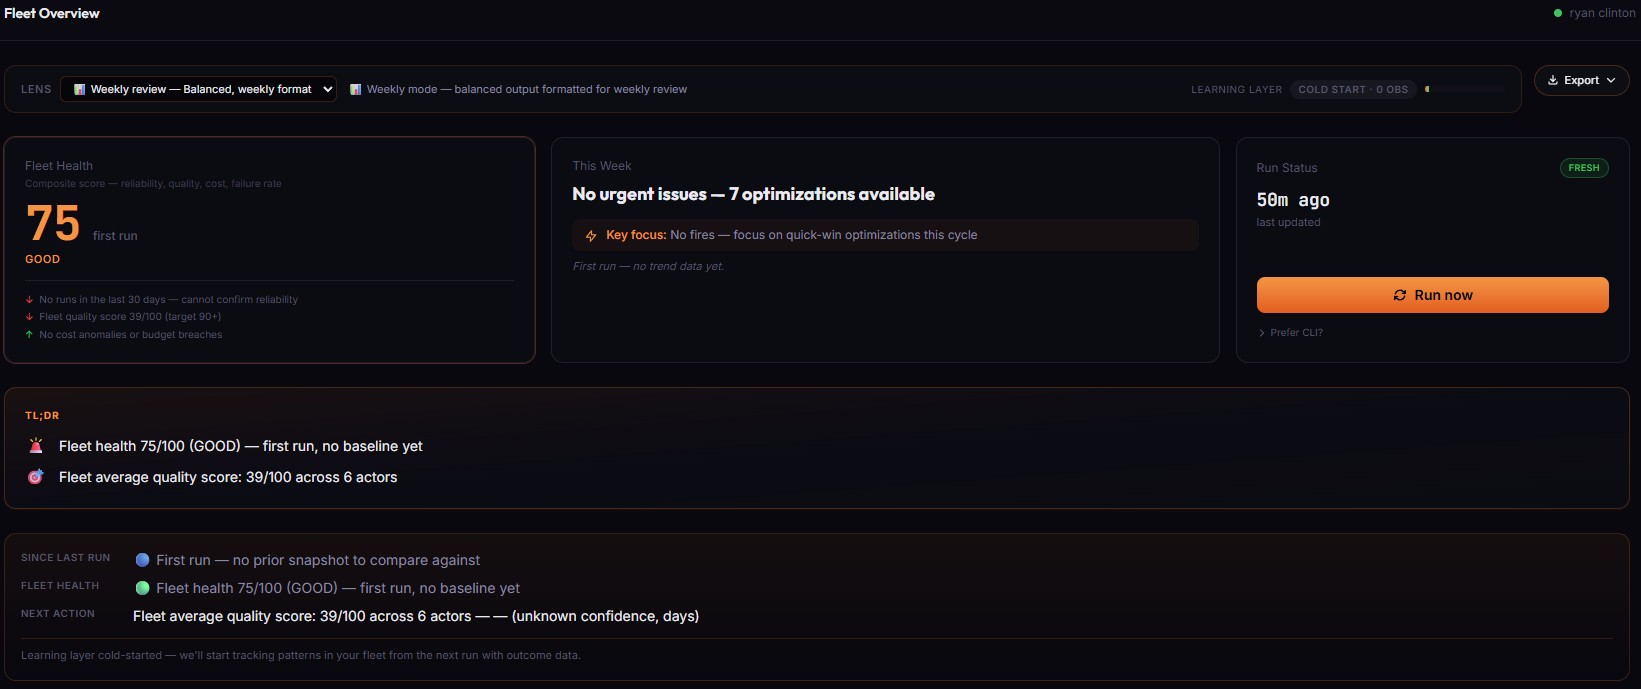
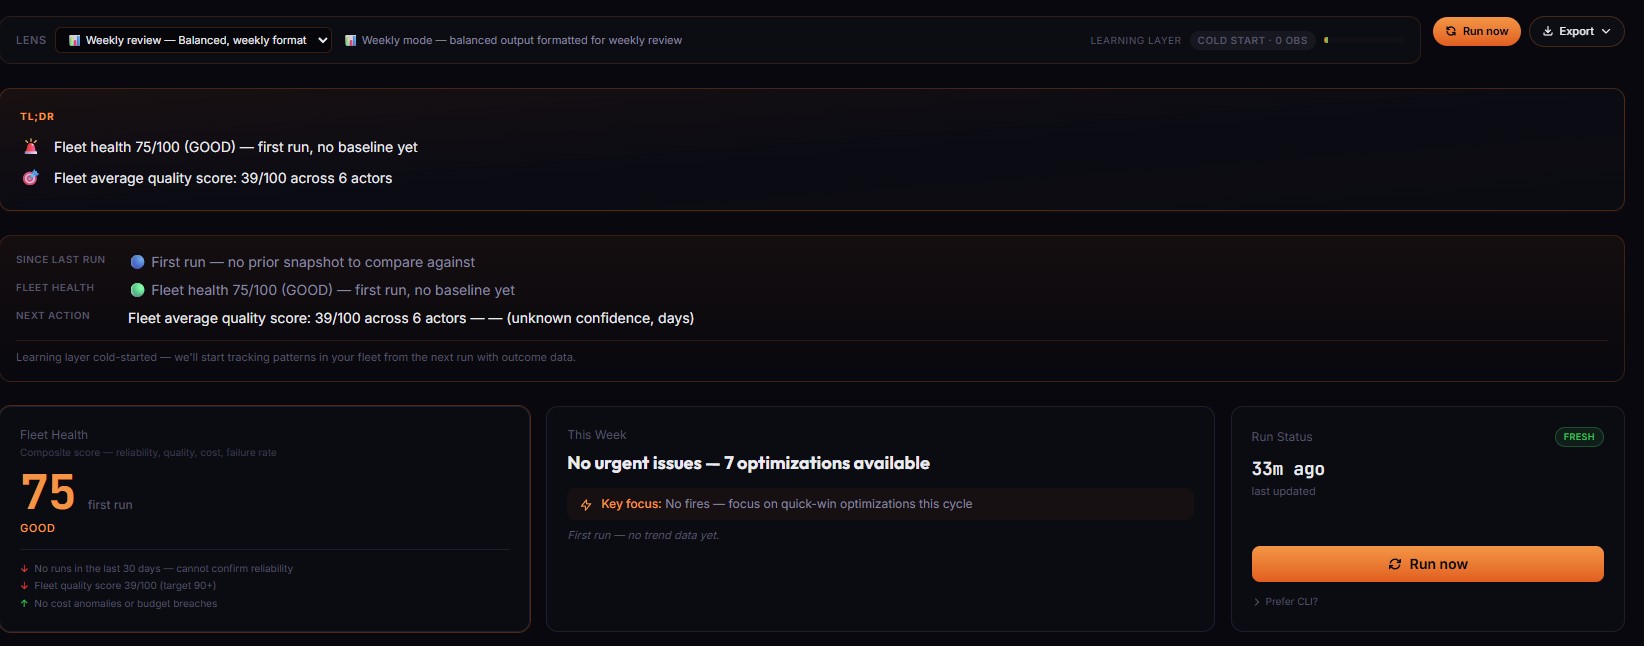
- Fleet Analytics computes a 0–100 Fleet Health Score from four inputs: success rate, cost efficiency, regression signals, and build freshness.
- The Action Plan buckets recommendations into four categories — Fix Now, Optimize Next, Build Next, Consider Archiving — so the next action is always explicit.
- The backend actor runs on your own Apify account via a scoped token. ApifyForge does not have your credentials and cannot run actors on your behalf without one.
- The token is encrypted at rest in ApifyForge with AES-256-GCM, using a server-held key that never lives in the database or logs.
- For high-sensitivity data, there is a CLI flow (
npx apifyforge run fleet-analytics) where the token stays entirely on your local machine.
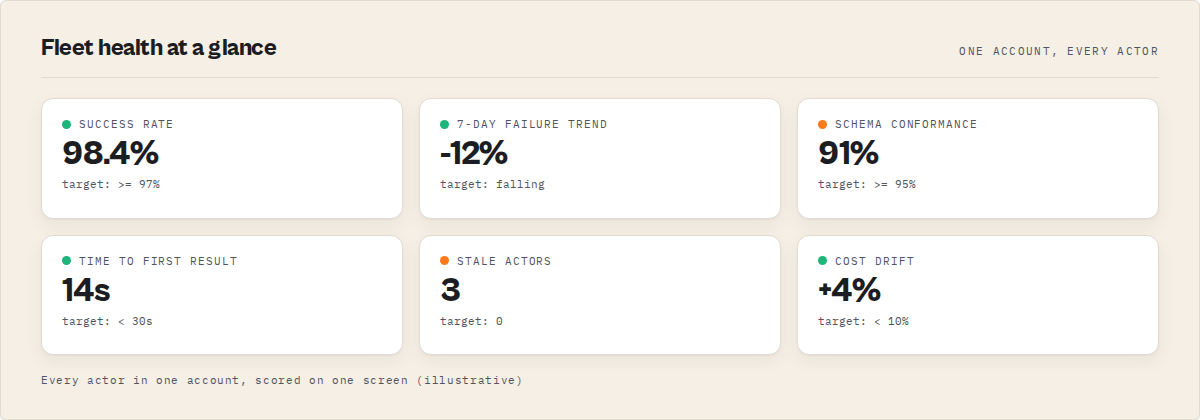
Example outputs at a glance
| Section | Example metric | What it answers |
|---|---|---|
| Fleet Health Score | 0–100 composite | Is the account trending up or down overall? |
| Fix Now bucket | Actor with a new failure spike | What is actively broken this week? |
| Optimize Next bucket | Actor with rising cost per run | Where is spend drifting without a feature change? |
| Build Next bucket | Actor with growing usage | Which actors deserve more investment? |
| Consider Archiving bucket | Actor with zero runs for N weeks | What's dead weight in the account? |
What is Fleet Analytics?
Shortest definition: Fleet Analytics = one dashboard for all your Apify actors (health, cost, failures).
One-line definition: Fleet Analytics is an account-wide dashboard for Apify actors that turns per-actor API data into a single operational view.
In two lines: Fleet Analytics is an account-wide observability layer for Apify actors. It aggregates per-actor data into a single operational dashboard.
Definition (short version): Fleet Analytics is an ApifyForge feature that aggregates Apify actor metadata, run history, and build history across an entire Apify account into a single operational dashboard with a composite Fleet Health Score and a prioritized Action Plan.
Expanded: Fleet Analytics is an account-wide observability layer for developers managing multiple Apify actors. It reads through the Apify API using a scoped token that the developer provides, computes aggregate metrics across every actor on that account, and renders them in a single ApifyForge dashboard view. The scope is the whole account, not one actor at a time.
There are five things Fleet Analytics computes, and the rest of the feature is built around them:
- Fleet Health Score. A 0–100 composite metric built from success rate, cost efficiency, regression signals, and build freshness.
- Action Plan. A prioritized list of next actions, bucketed into Fix Now (critical), Optimize Next (high ROI), Build Next (growth), and Consider Archiving (cleanup).
- Cost aggregates. Spend per actor, spend trends over time, and cost outliers relative to the actor's own baseline.
- Failure patterns. Failure rate per actor, plus silent failures detected from run history where the status was successful but the dataset was empty or shape-broken.
- Week-over-week trend deltas. Every metric is compared against the last Fleet Analytics run so the dashboard surfaces what changed, not just the current state.
How to measure the health of multiple Apify actors
A practical way to measure fleet-level health for a set of scraping jobs is to combine four complementary signals:
- Success rate — are runs completing successfully across the fleet, and is that rate trending up or down over time?
- Cost efficiency — is cost per run stable for each actor, or drifting upward without a corresponding change in feature scope?
- Regression signals — are failures increasing week over week, including silent failures where the run status is successful but the dataset is empty or shape-broken?
- Build freshness — are actors being rebuilt and updated when they need to be, or are they drifting out of sync with upstream changes?
Fleet Analytics combines these four inputs into a single 0–100 Fleet Health Score so that trend changes across the whole account are visible at a glance, rather than buried inside individual actor views. The same four signals underpin the Action Plan bucketing — a failing actor shows up in Fix Now, a cost-drifting actor in Optimize Next, a growing-usage actor in Build Next, and a zero-runs actor in Consider Archiving.
The same pattern works even if you don't use Fleet Analytics: if you're rolling your own monitoring against the Apify API, these four signals are the minimum set you want to track per actor to get a meaningful operational view of a multi-actor fleet. These four signals are the minimum set required for a meaningful operational view of any scraping system, not just Apify — the same pattern applies to AWS Lambda functions that run crawlers, to Kubernetes jobs that run ETL, or to any periodic workload where each unit has its own failure mode and cost profile.
Why managing multiple Apify actors needs its own view
The Apify Console is optimized for building and debugging a single actor. That is the correct primitive when you are focused on one actor at a time. But once you are managing a larger set of actors on one account, the per-actor view has a cost: every aggregate question becomes a manual tab-switching exercise. Want to know total spend this week? Click through every actor. Want to know which actors failed runs yesterday? Click through every actor.
According to the Apify platform documentation, the /v2/acts endpoint lists all actors on an account, but each actor's runs, builds, and logs are fetched individually. The Apify API reference for actor runs confirms that run listings are scoped per-actor. There is no native rollup across actors in the default Console UI. This isn't a bug — it's a scoping decision that works well for most users and less well for developers who treat their actors as a portfolio.
Fleet Analytics exists because aggregate questions need an aggregate view. The underlying data is already in the Apify API. The missing piece is the rollup.
How Fleet Analytics works under the hood
In one line: Fleet Analytics runs as a backend actor on your own Apify account, writes its output to a dataset, and caches that output in ApifyForge for the dashboard to render from.
In plain terms: it runs one actor to analyze all your other actors, then displays the results in a single dashboard.
Fleet Analytics runs as a six-step pipeline. The architectural signature is that the backend actor runs on your own Apify account, not on ApifyForge's infrastructure, so you stay in control of the compute and the data never leaves your Apify account during collection.
- You create a scoped Apify API token with five permissions: Actors (Read + Run + List runs) and Storages (Read + Write), plus the "Allow this token to access default run storages" toggle under Running Actors. ApifyForge's scoped token walkthrough covers the exact clicks.
- You paste the token into ApifyForge Settings. It is encrypted at rest with AES-256-GCM, the authenticated-encryption mode specified in NIST SP 800-38D, using a server-held key that lives only in the ApifyForge server environment — never in the database, never in logs. See our API token storage disclosure for the full details.
- You click Run Fleet Analysis. ApifyForge triggers a backend actor called
fleet-analyticson your Apify account via the scoped token. You pay for the run on your own Apify account under Pay-Per-Event pricing. - The backend actor collects data. It reads actor metadata, run history, and build history through the Apify API, aggregates everything, computes the Fleet Health Score and Action Plan, and writes its output to a dataset on your account.
- ApifyForge reads the dataset back via the same scoped token and caches the computed metrics in its PostgreSQL database so the dashboard renders quickly on subsequent page loads.
- The dashboard renders from that cache. Clicking Run again refreshes the cache with a new backend actor run.
What the backend actor outputs
Fleet Analytics outputs a structured JSON document containing:
- a Fleet Health Score (0–100 composite metric)
- four component sub-scores — success rate, cost efficiency, regression signals, build freshness
- a four-bucket Action Plan — Fix Now, Optimize Next, Build Next, Consider Archiving
- week-over-week deltas across total runs, spend, and failure rate
The document is structured like this at the top level:
| Field | Description |
|---|---|
fleetHealthScore | Composite 0–100 directional metric |
components | Sub-scores: successRate, costEfficiency, regressionSignals, buildFreshness |
actionPlan | Four buckets: fixNow, optimizeNext, buildNext, considerArchiving |
weekOverWeek | Delta metrics against the previous Fleet Analytics run |
ApifyForge reads this document back from the run's default dataset and renders the dashboard from cached copies. Nothing in the dashboard is computed client-side — everything is produced by the backend actor running on your Apify account and then mirrored into ApifyForge's PostgreSQL cache.
The trust model: what ApifyForge can and cannot touch
Short answer: ApifyForge is safe to use with a scoped token, but the Storages: Read permission technically covers every dataset on the account. In practice, access is restricted by ApifyForge's code to only the datasets Fleet Analytics itself produced — this is a code-enforced boundary, not a platform-enforced one. For high-sensitivity data, use the CLI flow, which keeps the token entirely on your own machine. This is the key tradeoff to understand before using any tool built on top of the Apify API — scoped tokens narrow the permission surface, but Apify's permission schema bundles storages together, so every tool in this space has the same structural limitation.
Fleet Analytics uses a scoped token, not a full-access token, and this is the important part. The scope restricts what ApifyForge can see and do, and it matters to state the boundaries honestly rather than gloss over them.
| Capability | Allowed |
|---|---|
| Read actor metadata | Yes |
| Read actor builds (read-only) | Yes |
Trigger the fleet-analytics backend actor | Yes |
| Read run history (status, duration, cost) | Yes |
| Read datasets ApifyForge's backend actors produced | Yes |
| Read all datasets on the account via token scope | Technically yes |
| Restricted in practice to only our backend actor datasets | Yes (code-enforced, not platform-enforced) |
| Write to storages during a backend run | Yes |
| Modify actor source code | No (blocked at Apify platform level) |
| Create, delete, or rename actors | No |
| Trigger new actor builds | No |
| Access billing or payment methods | No |
| Create new API tokens | No |
| Touch actors on other users' accounts | No |
| Local-only option (token never leaves your machine) | Yes, via CLI |
What the scoped token allows: Actors (Read + Run + List runs) lets ApifyForge read actor metadata, list runs, and trigger the fleet-analytics backend actor. Storages (Read + Write) lets ApifyForge read the dataset the backend actor writes, and write its own intermediate data. The "default run storages" toggle lets the token read the default dataset attached to a run.
What the scoped token blocks: ApifyForge cannot modify actor source code (blocked at the Apify platform level by the token scope), cannot access billing, cannot create new API tokens, and cannot touch actors owned by other users on other accounts.
The honest disclosure: the Storages: Read permission technically covers every dataset on the account, not just datasets produced by ApifyForge's backend actors. In practice, ApifyForge's code only reads datasets produced by its own backend actors — and this is enforced by code, which is inspectable in src/lib/apify/runner.ts, rather than by Apify's permission schema itself. That's a procedural boundary, not a platform-enforced one. For high-sensitivity datasets where you want a platform-enforced boundary, the CLI flow (npx apifyforge run fleet-analytics) keeps the token entirely on your local machine and never transmits it to the ApifyForge server. See what data ApifyForge can access for the full breakdown.
This is the disclosure in one sentence: the scoped token is narrower than a full-access token, but it is not narrower than "only the datasets ApifyForge wrote." If that matters for your data, use the CLI.
What are the alternatives to Fleet Analytics?
Alternatives to the Apify Console for multi-actor monitoring
If you need an aggregated view across multiple Apify actors, these are the main approaches — from zero-setup and per-actor to full custom infrastructure.
Fleet Analytics is one of several ways to get an aggregate view across multiple Apify actors. It's worth naming the alternatives fairly.
- Apify Console (default). Free, built-in, always up to date. No aggregation across actors — every question is answered one actor at a time. Best for: users running one or two actors.
- Custom scripts against the Apify API. You write Python or Node scripts that call
/v2/actsand/v2/actor-runsand roll up the numbers yourself. Complete flexibility, zero dashboard. Best for: teams with in-house engineering capacity who want full control over metrics. - Generic observability platforms (Datadog, Grafana, etc.). You pipe Apify run data into a generic metrics platform. Powerful dashboards, steep setup cost, not Apify-aware (no Fleet Health Score, no native Action Plan). Best for: teams already on a platform where Apify data joins other observability data.
- Apify webhooks into a custom database. You wire
ACTOR.RUN.*webhooks (documented in the Apify webhooks reference) to a backend you run yourself and compute rollups over the resulting event stream. Real-time, flexible, requires you to operate the backend. Best for: developers who want per-run events more than aggregate rollups. - ApifyForge Fleet Analytics. Apify-native aggregate view with Fleet Health Score and Action Plan, scoped-token architecture, runs on your own account. Best for: developers managing multiple Apify actors who want a dashboard without building one.
| Approach | Setup cost | Aggregate metrics | Apify-native | Compute runs on |
|---|---|---|---|---|
| Apify Console | None | Per-actor only | Yes | Apify platform |
| Custom API scripts | High | Whatever you code | Yes | Your machine / CI |
| Datadog / Grafana | High | Generic metrics | No | External platform |
| Webhooks + custom DB | Medium–high | Event-based rollups | Partial | Your backend |
| ApifyForge Fleet Analytics | Low (paste a token) | Fleet Health Score + Action Plan | Yes | Your own Apify account |
Pricing and features based on publicly available information as of April 2026 and may change.
Each approach has trade-offs in setup cost, flexibility, and where the compute runs. The right choice depends on how many actors you manage, whether you have engineering capacity for custom dashboards, and how much you value an Apify-native rollup over a generic one. Fleet Analytics is the only option in this comparison that provides a pre-built fleet-level dashboard for Apify actors without requiring custom infrastructure.
Best practices for using Fleet Analytics
- Run Fleet Analysis on a regular cadence (weekly is a reasonable default). Week-over-week deltas only mean something if you run often enough to have a baseline.
- Action the Fix Now bucket first before touching anything else — it's the highest-severity bucket and it's ordered by impact.
- Treat Consider Archiving as a conversation, not an instruction. An actor with zero runs for a while might be seasonal, not dead.
- Watch cost efficiency, not just total spend. An actor getting more expensive per run is often a signal something changed upstream — rate limits, site structure, retry loops.
- Use the CLI flow if your datasets contain sensitive data. The architectural boundary is stronger when the token never leaves your machine.
- Compare build freshness against your own release cadence. "Stale" is relative — a backend actor untouched for months may be fine if it was correct when you shipped it.
- Treat the Fleet Health Score as a direction, not a grade. The number matters less than whether it's moving up or down over time.
- Run Fleet Analytics after big changes (a new deployment, a new actor, a platform upgrade) so the next baseline captures the new state.
Common mistakes when using Fleet Analytics
- Granting a full-access token instead of a scoped one. Always create a new scoped token with exactly the five permissions listed in the token walkthrough. A full-access token gives ApifyForge more than it needs.
- Running Fleet Analysis once and never again. Week-over-week deltas are the most useful signal. A single run is a snapshot, not a trend.
- Assuming Fleet Health Score is an absolute benchmark. It's a composite, not a grade against other accounts. Use it for trend, not comparison.
- Ignoring silent failures because runs look green. Silent failures show up in the Action Plan even when Apify marks the run as successful. Don't skip them because the run status is fine.
- Forgetting that backend actor runs cost credits on your account. Fleet Analytics runs on your Apify account, so each Run Fleet Analysis consumes Apify Pay-Per-Event credits on your side.
How to try Fleet Analytics
- Open Apify Console, go to Settings → Integrations → API tokens, and click Create new token.
- Follow the ApifyForge scoped-token walkthrough to set exactly the five permissions needed.
- Enable the "Allow this token to access default run storages" toggle under Running Actors.
- Copy the token, open ApifyForge, go to Settings, and paste it in.
- Click Run Fleet Analysis.
- Review the Fleet Health Score, then walk the Action Plan top-down starting with Fix Now.
If you prefer to keep the token entirely on your own machine, the CLI alternative is npx apifyforge run fleet-analytics — no server-side token storage, no ApifyForge cache layer, the output is whatever the backend actor writes to your dataset. It's the right choice for sensitive data or for anyone who wants a platform-enforced boundary rather than a code-enforced one.
Limitations of Fleet Analytics
Fleet Analytics has real constraints and it's worth being explicit about them.
- Single Apify account per ApifyForge connection. If you run actors across multiple Apify accounts, you get one Fleet Analytics view per account, not a merged view.
- Depends on the scoped token staying valid. If you revoke the token in Apify Console, Fleet Analytics stops running until you create a new one.
- Backend actor runs cost credits on your account. Fleet Analysis is not free compute — each run consumes Apify Pay-Per-Event credits on your account.
- The Storages: Read boundary is code-enforced, not platform-enforced. Described in the trust model section above. For high-sensitivity data, use the CLI flow.
- Fleet Health Score is a composite, not a benchmark. It's designed to show whether your account is trending up or down, not to compare against other developers.
When you should NOT use Fleet Analytics
Fleet Analytics is the wrong tool for some use cases, and it's worth naming them explicitly so you can pick something better-suited if one of these fits.
Use custom scripts or a generic observability platform instead if:
- You need cross-account aggregation. Fleet Analytics is per-account — one scoped token, one account, one dashboard. If you run actors across multiple Apify accounts and need a merged view, you'll need to roll up multiple Fleet Analytics instances yourself or build a direct API-based aggregator that talks to each account's token.
- You already have a metrics pipeline. If you've already piped Apify webhooks or polling into Datadog, Grafana, a data warehouse, or any other observability stack, Fleet Analytics duplicates a surface you already have. Extending your existing pipeline with Apify-specific metrics is usually the right move.
- You need real-time per-run alerting. Fleet Analytics is a periodic rollup — you click Run, it runs, you look at the result. If you need a page-me-the-second-a-run-fails workflow, use Apify's native webhooks into an alerting backend. Webhooks fire per run; Fleet Analytics aggregates across runs.
- Your datasets contain regulated data and your threat model rules out server-side token storage. Use the CLI flow instead (
npx apifyforge run fleet-analytics) — same analytics output, token never leaves your machine.
If none of those apply and you're managing multiple Apify actors on one account, Fleet Analytics is the low-setup default.
Key facts about Fleet Analytics
- Fleet Analytics aggregates across every actor in one Apify account, not one actor at a time.
- The Fleet Health Score is a 0–100 composite of success rate, cost efficiency, regression signals, and build freshness.
- The Action Plan has four buckets: Fix Now, Optimize Next, Build Next, Consider Archiving.
- Fleet Analytics runs on your Apify account via a scoped token, not on ApifyForge infrastructure.
- The scoped token requires Actors (Read + Run + List runs) and Storages (Read + Write), plus the default run storages toggle.
- Tokens are encrypted at rest in ApifyForge with AES-256-GCM using a server-held key.
- A CLI flow (
npx apifyforge run fleet-analytics) keeps the token entirely on the user's local machine. - Fleet Analytics tracks week-over-week deltas so the dashboard surfaces change, not just state.
Short glossary
- Apify actor — a containerized program that runs on the Apify platform, typically a web scraper or data-processing job.
- Scoped API token — an Apify API token with a narrowed set of permissions, as opposed to a full-access token that can do everything on the account.
- Pay-Per-Event (PPE) — Apify's pricing model where customers pay for specific events (e.g. per successful result) rather than for compute time. Covered in our PPE pricing learn guide.
- Fleet Health Score — Fleet Analytics' 0–100 composite metric for an Apify account as a whole.
- Action Plan — Fleet Analytics' prioritized list of next actions, bucketed into Fix Now, Optimize Next, Build Next, and Consider Archiving.
- Silent failure — a run that Apify marks as successful but produces an empty or malformed dataset.
Common misconceptions
- "ApifyForge runs actors on my behalf from its own servers." No. Fleet Analytics triggers the
fleet-analyticsbackend actor on your own Apify account via the scoped token you provide. ApifyForge does not run actors for you from its own infrastructure. - "A scoped token means ApifyForge can only read datasets it wrote." Not exactly. Storages: Read technically covers all datasets on the account. The boundary to "only datasets ApifyForge wrote" is enforced by ApifyForge's code, not by Apify's permission schema. This is the honest version.
- "Fleet Health Score compares my account against other developers." No. It's a composite metric scored against itself over time. Its job is to show direction, not ranking.
Broader applicability: fleet-level observability as a pattern
The pattern Fleet Analytics implements — aggregate a per-resource API into a per-account operational view — shows up in a lot of places beyond Apify. These are universal principles for anyone building or buying this kind of tool:
- Aggregate questions need aggregate views. Per-resource APIs are fine primitives, but once you run more than a handful of resources, you need rollups. That's true for Apify actors, AWS Lambda functions, Kubernetes pods, or Stripe products.
- Week-over-week deltas beat point-in-time snapshots. Change signals are more actionable than state signals.
- Scoped tokens beat full-access tokens by default. Always narrow the permission surface to the minimum the feature needs.
- Honest disclosure beats marketing language. State the boundary where a feature is code-enforced rather than platform-enforced, because users auditing your tool will find it anyway.
- Give users a local-only fallback for sensitive data. A CLI or local-runner path respects users whose data can't leave their machine.
When you need a fleet dashboard (and when you don't)
You probably want Fleet Analytics if:
- You manage multiple Apify actors on one account.
- You want to see cost trends and failure patterns across the whole account, not one actor at a time.
- You want a prioritized Action Plan instead of clicking through every actor to decide what to fix.
- You value week-over-week deltas as a signal.
You probably don't need Fleet Analytics if:
- You only run one or two actors — the Apify Console's per-actor view is the right tool.
- You already have a custom observability stack wired into Apify webhooks that produces the metrics you care about.
- Your Apify actors are experimental and not production-critical.
- You run actors across multiple Apify accounts and want a merged view (Fleet Analytics is per-account).
- You're not comfortable with a code-enforced rather than platform-enforced boundary on Storages: Read, and the CLI flow isn't an option for your workflow.
Frequently asked questions
What is Apify Fleet Analytics?
Apify Fleet Analytics is an ApifyForge feature that aggregates actor metadata, run history, and build history across an entire Apify account. It computes a Fleet Health Score, a prioritized Action Plan, cost aggregates, failure patterns, and week-over-week deltas, rendered in one dashboard instead of requiring a manual tab-switch through every actor in the Apify Console.
How does Fleet Analytics work?
You create a scoped Apify API token with specific permissions, paste it into ApifyForge Settings, and click Run Fleet Analysis. ApifyForge triggers a backend actor called fleet-analytics on your own Apify account. The backend actor reads through the Apify API, computes all the metrics, and writes the output to a dataset. ApifyForge caches that output in its database and renders the dashboard from the cache.
Is ApifyForge safe to connect to my Apify account?
ApifyForge uses a scoped Apify API token, not a full-access one. The scoped token allows Actors (Read + Run + List runs) and Storages (Read + Write), plus the default run storages toggle. It cannot modify actor source code, access billing, or create new tokens. Tokens are encrypted at rest with AES-256-GCM. The honest caveat is that Storages: Read technically covers all datasets on the account — in practice ApifyForge's code only reads datasets produced by its own backend actors, but that's enforced by code, not by the Apify permission schema. For high-sensitivity data, a CLI flow keeps the token on your local machine.
Does Fleet Analytics cost anything to run?
The fleet-analytics backend actor runs on your Apify account, so each Run Fleet Analysis consumes Apify Pay-Per-Event credits on your side. ApifyForge does not charge for the Fleet Analytics dashboard itself. You pay Apify for the backend actor run on your own account, the same way you would pay for any other actor run you trigger.
Can Fleet Analytics see actors on other Apify accounts?
No. The scoped token is tied to the Apify account that issued it, and the Apify platform enforces that an account's token can only read resources owned by that account. Fleet Analytics is a per-account view. If you run actors across multiple Apify accounts, you get one Fleet Analytics view per account rather than a merged cross-account view.
How often should I run Fleet Analytics?
A weekly cadence is a reasonable default because the week-over-week deltas are one of the most useful signals the dashboard produces. Running it too infrequently loses the trend data. Running it after major changes — a new deployment, a new actor, a platform upgrade — captures the new baseline so the next run has something to compare against. There is no platform penalty for running it more often; the only cost is the backend actor's Pay-Per-Event credits on your Apify account.
What's the difference between Fleet Analytics and Apify webhooks?
Apify webhooks are real-time per-run event notifications — they fire on each run and are great for alerting. Fleet Analytics is an aggregate, periodic rollup across all actors on the account — it answers questions like "what changed across the fleet this week" rather than "did this specific run just fail." The two are complementary: webhooks for real-time alerting, Fleet Analytics for account-wide trend and prioritization.
Can I run Fleet Analytics without giving ApifyForge my token?
Yes. The CLI flow (npx apifyforge run fleet-analytics) runs the same backend actor on your own Apify account using a token that stays on your local machine. Nothing is transmitted to the ApifyForge server in that flow, which gives you a platform-enforced boundary instead of a code-enforced one. The tradeoff is that you don't get the ApifyForge dashboard cache — you get whatever output the backend actor writes to your dataset, which you view or process locally.
Closing
Fleet Analytics is how we turn Apify's per-actor API into an operational view of your whole account. The Apify Console remains the right tool for building, testing, and debugging a single actor. Fleet Analytics is the right tool when the question you need answered is about the fleet, not the individual actor — which failure rate is climbing, which spend is drifting, which builds have gone stale, and what should be fixed first.
The architectural signature is that it runs on your own Apify account via a scoped token, with a CLI fallback for users who prefer a platform-enforced trust boundary over a code-enforced one. That's the whole feature.
Ryan Clinton runs ApifyForge and publishes open developer tools for the Apify platform.
Last updated: April 2026
This guide focuses on the Apify platform, but the same fleet-level observability patterns apply broadly to any system where a per-resource API needs to be rolled up into a per-account operational view.