Google Maps Scraper — Rank Tracking & Market Intelligence is an Apify actor on ApifyForge. Scrapes Google Maps and returns a market intelligence read: saturation, underserved areas, competitor movers, geo-grid rank, Share of Local Voice, and tracked market history. Best for sales teams and marketers who need verified contact data, lead lists, or prospect enrichment at scale. Not ideal for real-time monitoring or historical data analysis. Maintenance pulse: 90/100. Last verified March 27, 2026. Built by Ryan Clinton (ryanclinton on Apify).
Google Maps Scraper — Rank Tracking & Market Intelligence
Google Maps Scraper — Rank Tracking & Market Intelligence is an Apify actor available on ApifyForge. Scrapes Google Maps and returns a market intelligence read: saturation, underserved areas, competitor movers, geo-grid rank, Share of Local Voice, and tracked market history. Replaces a monthly local-SEO subscription for agencies, franchises, and investors. Pay-per-event.
Best for sales teams and marketers who need verified contact data, lead lists, or prospect enrichment at scale.
Not ideal for real-time monitoring or historical data analysis.
What to know
- Results depend on publicly available data; private or gated contacts may not be found.
- Email verification accuracy varies by domain and provider policies.
- Requires an Apify account — free tier available with limited monthly usage.
Maintenance Pulse
90/100Documentation
What is Google Maps Scraper?
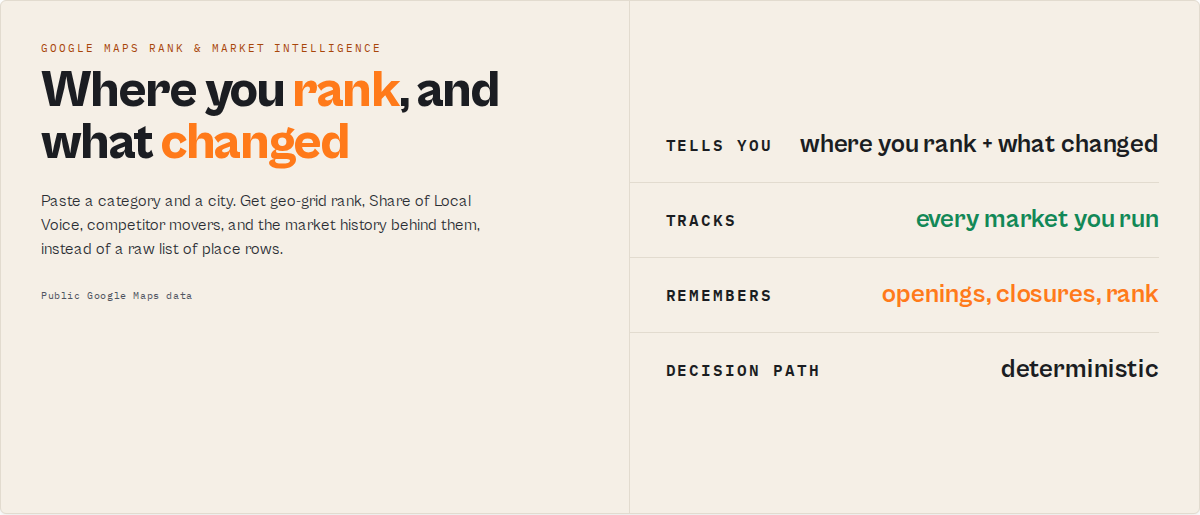
Google Maps Scraper tells you where a business ranks across Google Maps, who is gaining, and what changed in a local market over time. Give it a category and a location and it returns geo-grid rank and Share of Local Voice, competitor movers, market saturation and gaps, plus the tracked history behind it all. It works as a Google Maps rank tracker, a local competitor-analysis tool, and a market-saturation checker in one.
Category: Local market intelligence. Competitor and rank tracking. Google Maps data extraction. Primary use case: Read whether a local market is saturated, where the service gap is, and who is gaining. Can also be used for drop-in Maps data extraction and lead-list export.
What this actor does
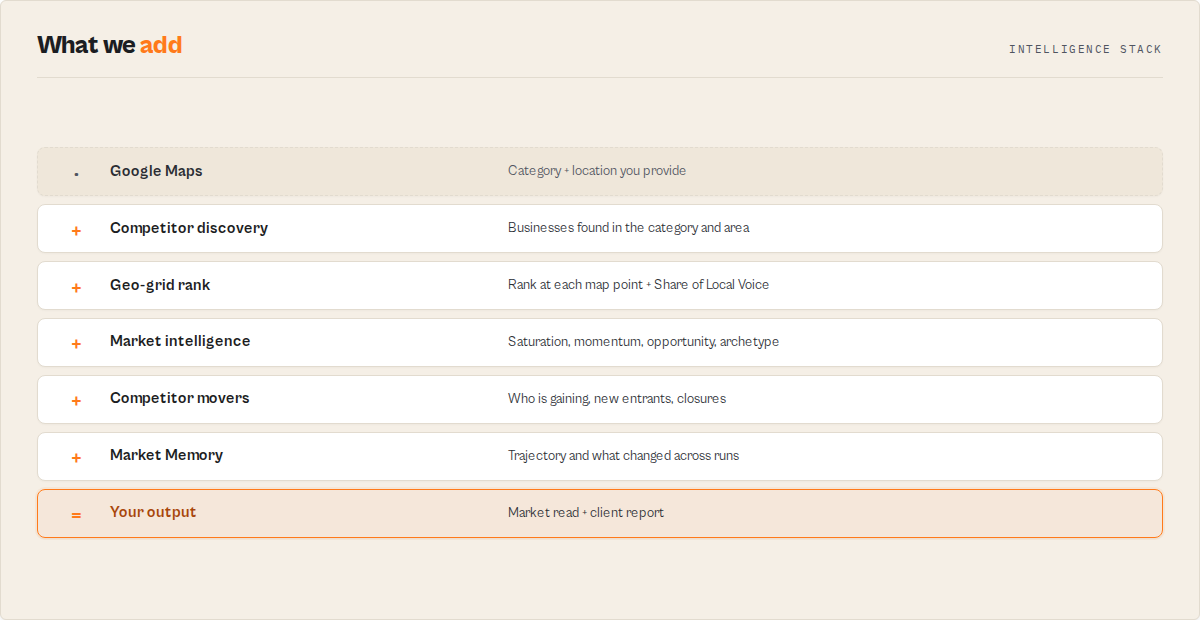
- What it is: A Google Maps scraper that adds a decision layer on top of place data.
- What it checks: Market saturation, service gaps, competitor momentum, where a business ranks across the map, and openings and closures over time.
- What it returns: A market read (opportunity index, saturation, gap count), per-business scores and archetypes, geo-grid rank and Share of Local Voice, and the tracked history behind it all.
- What it does NOT do: It is not a contact or lead-gen tool, and it does not predict business failure. Fading, at-risk, and closure labels are descriptive, evidence-backed reads, never solvency verdicts.
- Who it's for: Local SEO agencies, multi-location brands and franchises, SMBs, site-selection and real-estate teams, investors and analysts.
Google Maps Scraper is an Apify actor that turns a category plus a location into a finished market read instead of a raw list of place rows. Paste a category and a location and it returns saturation, underserved areas, competitor movers, and where each business ranks, plus the market history behind it. It functions as a local market intelligence API, producing the decision layer a local-SEO platform charges monthly for, on a per-run basis.
Other Maps scrapers give you a list of businesses today. Google Maps Scraper remembers the market. It keeps the openings, closures, rating trajectory, and rank shifts that Google Maps throws away, so you see whether a market is crowded, where the gap is, and who to watch. It returns the same Maps data as compass/crawler-google-places (set outputProfile: compat for the exact field set) plus the decision layer that scraper's own page promises. The real competitor is not another scraper. It is the spreadsheet and the local-SEO subscription.
In short: Paste a category and a location, get a market read and the history behind it, not just place rows.
What it is — A Google Maps scraper with a built-in market and competitor intelligence layer. Best for — Local SEO agencies, franchises, site selection, investors, SMB owners. Speed — Most market reads return within a few minutes; geo-grid runs scale with grid size. Pricing — Pay-per-event. Raw extraction stays competitive; intelligence surfaces carry the premium. Output — Structured dataset with a Market Overview, per-business scores, geo-grid rank, and a client report.
Key limitation: Market history starts empty. The first run of any market has no trajectory yet; openings, closures, and momentum deepen as you re-run it.
What it is not: Not a contact scraper, not a lead-enrichment tool, and not a business-failure predictor.
Does not include: Reviewer personal data, outreach or contact-pitch actions, or solvency verdicts on any business.
Results may be incomplete when: a market is read for the first time (no history), or a market is larger than a single map screen returns and no area polygon is set.
What you get from one call
Input: { "mode": "market", "searchTerms": ["dentist"], "location": "Austin, TX", "rankBy": "opportunity" }
Returns:
- A Market Overview: competitor count, saturation band, market state, opportunity index, and gap count
- Per-business records with an archetype, scores, why-now lines, and a recommended next step
- Competitor movers ranked by momentum, and underserved sub-areas ranked by opportunity
- A templated client report and a run summary you can hand to a client or manager
Typical time to first result: a few minutes for a single market. Typical time to integrate: under 30 minutes via the Apify API.
What makes this different
- Rank, not rows — Geo-grid mode reports where a business ranks at every point on a map and rolls it into a Share of Local Voice score, the local-rank-grid view local-SEO platforms sell.
- Market memory — Every run records a timestamped snapshot, so openings, closures, and rating trajectory accumulate. A clone cannot backfill local-market history.
- A decision, not a CSV — Each market comes back with a saturation read, an opportunity index, the gaps, and the movers, instead of 800 rows for you to sort by hand.
If you were building this yourself, you would need to scrape Maps at scale, run a coordinate grid for rank, store a timestamped snapshot per business, compute saturation and gap math per sub-area, and template a client-ready report.
Quick answers
What is it? Google Maps Scraper is a market intelligence actor that reads a category and location and returns saturation, gaps, competitor movement, and map rank, plus the history behind them.
How do I check if a local market is saturated? Run market mode with a category and location; the Market Overview returns a saturation band and a market state in one run.
What makes it different? It keeps the market history Google Maps discards, so it can tell you what changed, who is gaining, and where the gap is, not just who exists today.
What data sources does it use? Public Google Maps business listings, ratings, public review metadata, presence, and hours, accumulated over time in a market history store.
What does it return? A Market Overview, per-business scores and archetypes, geo-grid rank and Share of Local Voice, competitor movers, underserved areas, a client report, and a run summary.
How much does it cost? Pay-per-event. Raw place extraction stays competitive with plain Maps scrapers; the geo-grid, history, watchlist, and report surfaces carry the premium.
At a glance
Quick facts:
- Input: A category and a location (or a focal business, place URLs, or place IDs depending on mode)
- Output: Market Overview, per-business scores, geo-grid rank, competitor movers, underserved areas, client report, summary
- Modes: market, competitors, geo_grid, places, watchlist, replay
- Output profiles: signals (default), compat (raw Maps fields), minimal
- Rank by: opportunity, competitive position, momentum, rating, reviews, recency
- History: Built automatically when market memory is on (default), capped to a rolling window
- Pricing: Pay-per-event
Input → Output:
- Input: a category and a location
- Process: read the market, score every business, map the gaps and movers, and compare against tracked history
- Output: a structured dataset with a Market Overview default view plus deeper views
Best fit: local market saturation checks, competitor and rank monitoring, site selection, weekly client reporting, franchise and investor market scans Not ideal for: building contact or email lists (use a lead-enrichment actor), predicting whether a specific business will close, or analysing reviewer identities Does not include: reviewer personal data, outreach actions, or solvency verdicts
Problems this solves:
- How to tell if a local market is saturated or has room
- How to find underserved sub-areas for a new location
- How to track where a business ranks across the map over time
- How to see which competitors are gaining, fading, opening, or closing
Data trust: All reads derive from public Google Maps business data. Closed status and popular-times are passed through as Maps reports them. On a first run, trajectory and rank-over-time fields are null until history accumulates.
Common questions this actor answers:
- Is the [category] market in [city] saturated? The Market Overview returns a saturation band and market state for the category and area.
- Where should I open a [business]? Underserved-Area Radar ranks sub-areas by opportunity.
- Where do I rank on Google Maps across my area? Geo-grid mode reports rank per point and a Share of Local Voice score.
- Which competitors are gaining? Competitor Movers ranks businesses by momentum.
- Is there an alternative to a monthly local-SEO subscription? Google Maps Scraper produces the rank-grid and competitor reports those platforms sell, on a per-run basis.
Popular market checks
The same engine answers the questions buyers actually search for. Each is one run with a category and a city:
- Is [city] saturated for [category]? (for example, is Austin saturated for dentists?)
- Where should I open a [business] in [city]? (best place to open a med spa in Dallas)
- Which [category] are growing fastest in [city]? (fastest growing roofers in Phoenix)
- What new businesses opened in [city]? (new dentists in Miami)
- Where do I rank on Google Maps across [city]? (geo-grid rank for my clinic)
- Is the [category] market in [city] shifting? (Austin dentist market trends)
Ready-to-run versions of these live on the Examples tab of this actor's Store page.
Choose your mode
Six modes, one actor. Each takes the same category and location inputs where relevant.
market — the headline mode. A whole category and area: saturation, gaps, opportunity, and the competitor landscape.
{ "mode": "market", "searchTerms": ["dentist"], "location": "Austin, TX", "rankBy": "opportunity" }
competitors — a focal business and its area: where it ranks, who is gaining around it, and what customers say versus it.
{ "mode": "competitors", "focalBusiness": "Smile Dental Austin", "searchTerms": ["dentist"], "location": "Austin, TX" }
geo_grid — the local-SEO rank view. A grid of map points around a center reports the focal business's rank at each point and an aggregate Share of Local Voice.
{ "mode": "geo_grid", "focalBusiness": "Smile Dental Austin", "searchTerms": ["dentist"], "location": "Austin, TX", "grid": { "size": 5, "spacingMeters": 800, "rankDepth": 20 } }
places — intelligence per business for a list of names, URLs, or place IDs.
{ "mode": "places", "places": ["https://maps.google.com/?cid=123", "ChIJ..."], "location": "Austin, TX", "searchTerms": ["dentist"] }
watchlist — what changed in this market since the last run: new competitors, closures, rating moves, rank changes. Re-run with the same name to get the delta.
{ "mode": "watchlist", "watchlistName": "austin-dentists", "searchTerms": ["dentist"], "location": "Austin, TX" }
replay — a business's full tracked history: rating, review, and rank trajectory over time.
{ "mode": "replay", "places": ["ChIJ..."], "searchTerms": ["dentist"], "location": "Austin, TX" }
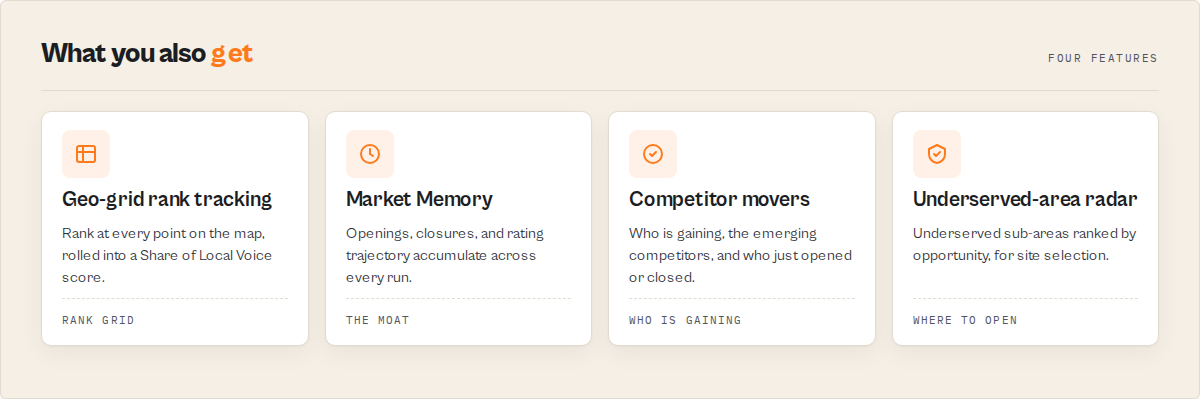
Google Maps geo-grid rank tracker and Share of Local Voice
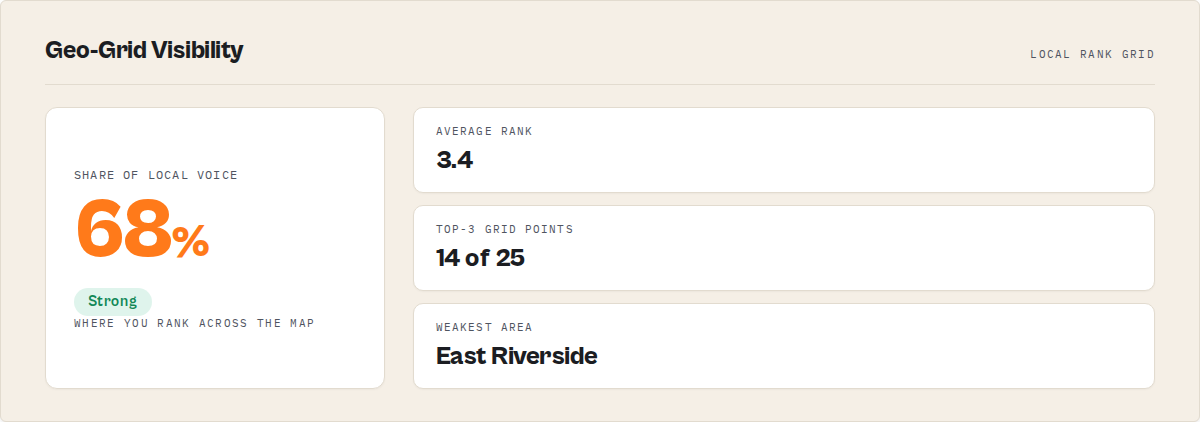
Rank. Geo-grid mode lays a grid of points across the map and reports where the focal business ranks at each one, the top competitors at each point, and an aggregate Share of Local Voice with a grade. This is the local-rank-grid product, deterministic and re-runnable for rank-over-time.
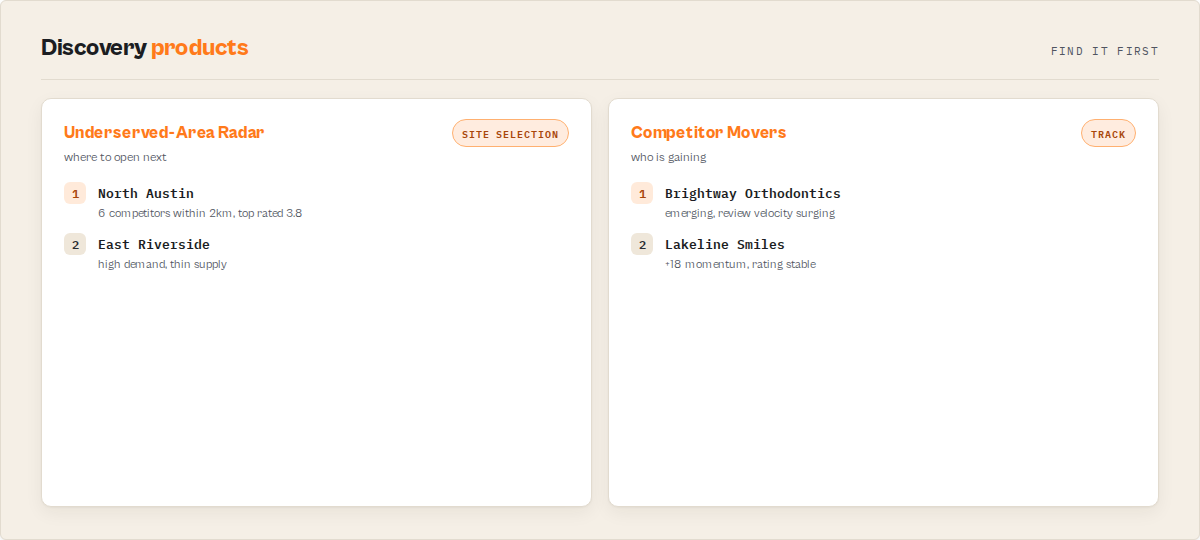
Track. Competitor Movers surfaces the businesses with the biggest momentum and rating moves. The actor flags emerging competitors (existing businesses suddenly accelerating), new entrants, and closures. A watchlist turns this into a recurring client feed, and the Market Feed flattens it into an event stream for Slack, Zapier, or an agent.
Discover. Underserved-Area Radar ranks sub-areas by opportunity, the Market Opportunity Index reads how attractive a market is to enter, and market concentration separates a market where the top five own most of the reviews from a fragmented one. This is the site-selection and white-space answer.
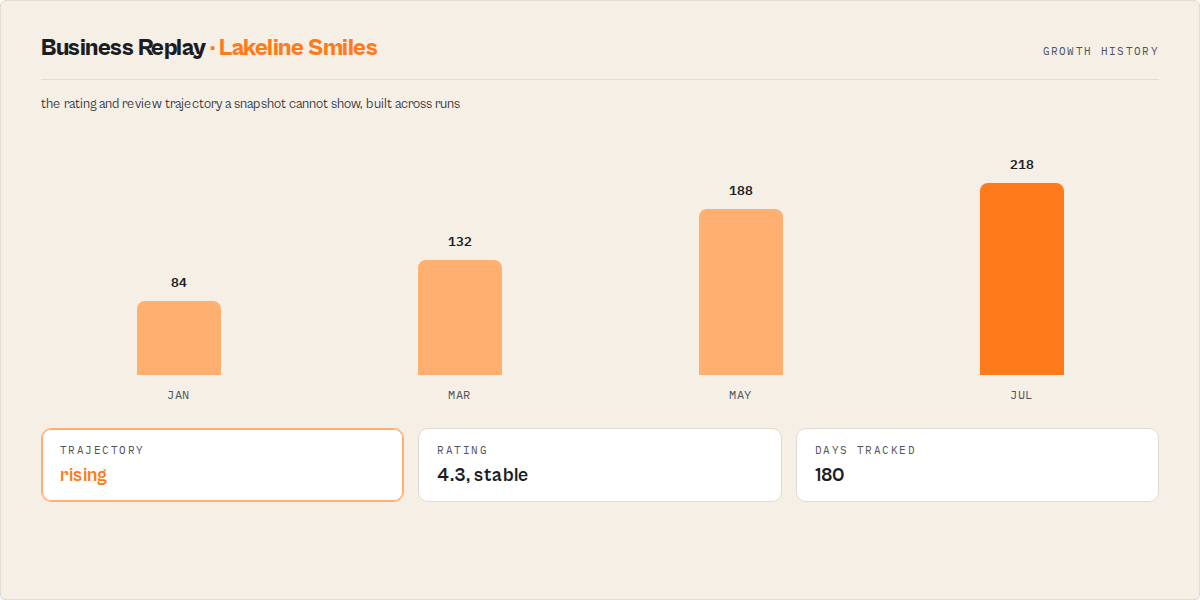
Remember. Market Memory records a timestamped snapshot of every business and market a run touches, so trajectory, openings, and closures accumulate at near-zero marginal cost. Business Replay then returns a single business's full story over time. History starts empty and compounds with use.
Market Memory: the part competitors cannot copy
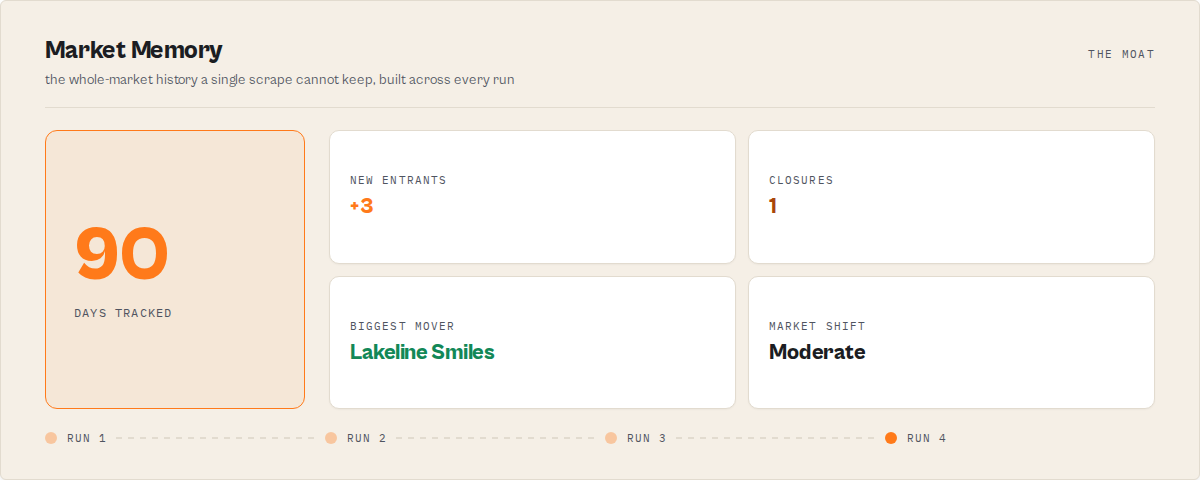
Most Google Maps tools show you what exists today. Market Memory remembers what changed:
- New competitors that opened
- Businesses that closed
- Rating moves over time
- Rank changes across the map
- Emerging competitors quietly accelerating
- Market-level shifts in a category and area
Every run a customer makes deepens the history, so the longer the actor is used on a market, the sharper its read of that market gets. A new clone starts from zero: it can copy the scraper, but it cannot backfill the local-market history. That accumulated history is the moat.
What changed since last week?
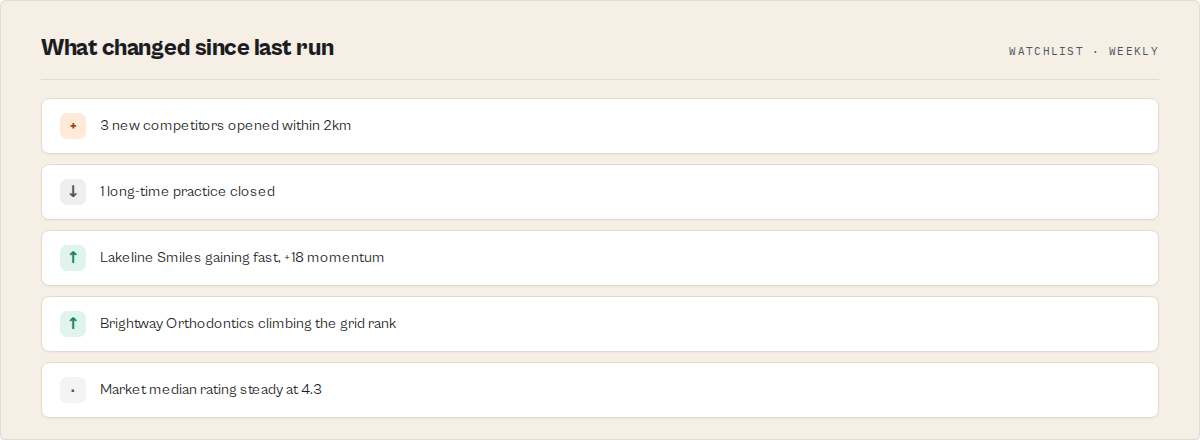
This is the workflow agencies, brands, and investors actually run on a schedule. Name a watchlist, re-run the market, and instead of the full list you get only the change set, ready for a client or a manager:
{
  "recordType": "watchlistBriefing",
  "headline": "3 new competitors, 1 closure, ABC Dental gaining fast",
  "newEntrants": 3,
  "closures": 1,
  "topMover": "ABC Dental Austin",
  "shareOfVoiceChange": "+8%",
  "marketShift": "moderate"
}
Pair it with reportFrequency and an Apify schedule and the brief lands weekly, monthly, or quarterly on its own. That recurring "what changed" loop, not the raw scrape, is the product.
The competitor you do not see coming
A new competitor opening is obvious. The dangerous one is the business that was already there and just started accelerating: review velocity surging, climbing the map rank, rating holding steady. Google Maps Scraper flags these as emerging competitors, separate from brand-new entrants. It is the earliest warning that someone is coming after your client's market, and it is impossible to detect without the tracked history this actor keeps.
Why use Google Maps Scraper for local market intelligence?
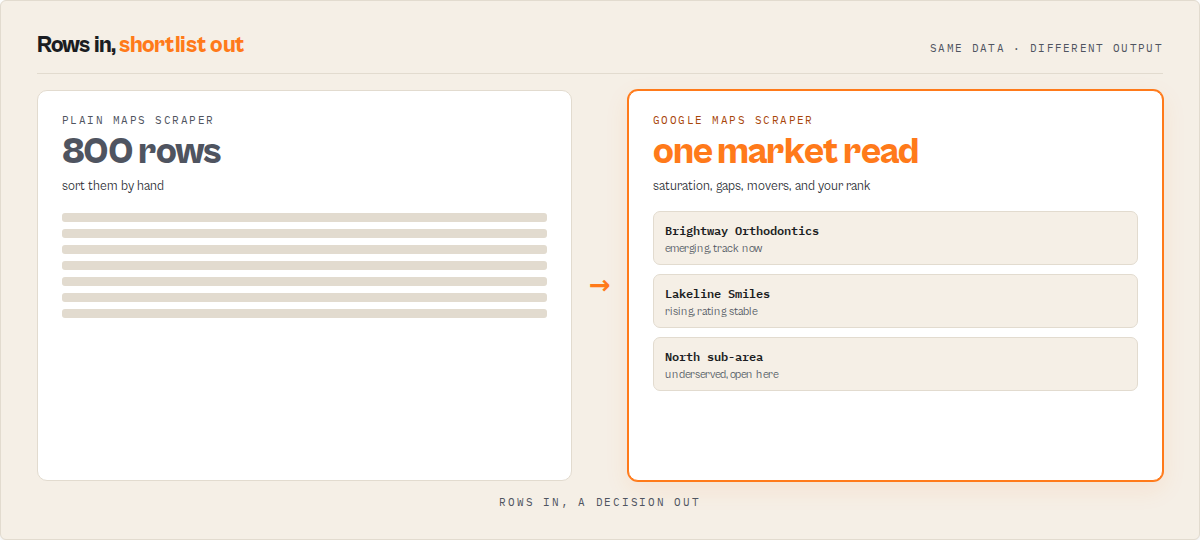
Before: Pull 800 businesses for a category and metro into a spreadsheet, then spend an hour sorting by rating and review count to guess whether the market is crowded and where the gap is. Repeat by hand every week to track competitors. After: Run one job and get the saturation read, the gaps, the movers, and each business's rank, with a tracked history behind it. The weekly re-run returns only what changed.
The buyer's pain was never getting Maps data. It is the interpretation: is this market saturated, where is the service gap, which competitor is gaining, and how do I rank locally. Local-SEO platforms answer that for a monthly seat. Google Maps Scraper produces the same rank grid, competitor reads, and client reports on a per-run basis.
Key difference: Google Maps Scraper keeps the market history Google Maps discards, so it can answer what changed, not just what exists today.
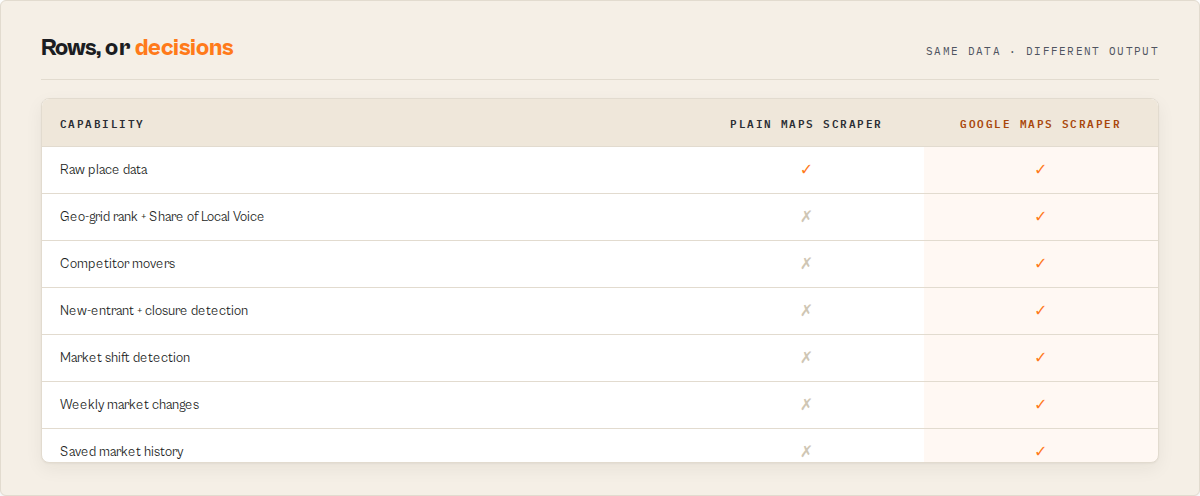
| Question a buyer actually asks | Plain Maps scrapers | Local-SEO subscriptions | Google Maps Scraper |
|---|---|---|---|
| Where do I rank across the map? | No | Yes | Yes |
| Who is gaining in my market? | No | Varies by plan | Yes |
| Which competitors just opened or closed? | No | Varies by plan | Yes |
| Is the market itself shifting? | No | Rarely | Yes |
| Is there saved market history to compare against? | No | Limited | Yes |
| Priced per run instead of a monthly seat? | Yes | No | Yes |
| Raw place fields for a drop-in migration? | Yes | Limited | Yes (compat profile) |
Pricing and features based on publicly available information as of June 2026 and may change.
Unlike a monthly local-SEO seat built for human-driven analysis, Google Maps Scraper is built for automation-first workflows. Unlike a plain Maps scraper that hands you rows to interpret, it returns a finished market read ready for a report or an agent.
Why this instead of a monthly local-SEO platform?
The rank grid and competitor tracking match what those platforms sell. The difference is how you run it and what it keeps:
| Monthly local-SEO platform | Google Maps Scraper | |
|---|---|---|
| Geo-grid rank and Share of Local Voice | Yes | Yes |
| Competitor tracking | Yes | Yes |
| Saved market history to compare against | Limited | Yes |
| API-first, scriptable from any pipeline | Limited | Yes |
| Built for automation and AI agents | Limited | Yes |
| Per-run pricing instead of a monthly seat | No | Yes |
Platform capabilities
- Scheduling — pair with an Apify schedule and
reportFrequencyto run a weekly, monthly, or quarterly market brief - API access — trigger from Python, JavaScript, or any HTTP client
- Proxy rotation — residential proxy support for reliable Maps access at scale
- Monitoring — webhook and alert support when runs fail
- Integrations — Zapier, Make, Google Sheets, webhooks, and AI agents via the Market Feed
Output: dataset views
The dataset opens on a Market Overview and lets you switch to deeper views, so a buyer reads the answer first and drills into the evidence after.
| View | What it shows | Audience |
|---|---|---|
| Market Overview (default) | Saturation, market state, opportunity index, gap count, momentum | The 5-second market read |
| Attention Queue | Per-business priority, archetype, why-now, recommended step | Per-business triage |
| Ignore Queue | Businesses safe to skip this run and why | Triage |
| Competitor Movers | Biggest momentum and rating moves | Local SEO, brands |
| Geo-Grid Visibility | Rank per map point plus Share of Local Voice | Local SEO |
| Client Report | A templated market-intelligence report | Agencies |
| Underserved-Area Radar | Sub-areas ranked by opportunity | Site selection |
| Business Replay | A business's rating, review, and rank trajectory | Brands, investors |
| New Since Last Run | What changed on a watchlist run | Watchlist, agencies |
| Market Feed | Events ranked by importance | Slack, Zapier, agents |
| Compat (raw places) | Exact place fields for migration and lead-gen | Migrators |
| Coverage & Errors | Coverage, warnings, failures | Trust, debug |
| Summary | Run rollup | Exec |
Headline scores: marketOpportunityIndex (how attractive a market is), localVisibilityShare (Share of Local Voice from the geo-grid), competitivePositionScore (a business's rank in its cohort), defensibilityScore (how exposed an existing business is), momentumScore (recent review momentum), saturationScore (competitor density), marketConcentration (fragmented to highly concentrated), and chainPresence (chain versus independent mix).
Features
Google Maps Scraper reads a category and location, scores every business in the market, maps the gaps and movers, and compares the result against tracked history. The capabilities below cluster into reading a market, tracking change, and remembering it.
Reading a market
- Six modes — market, competitors, geo_grid, places, watchlist, and replay from one actor.
- Saturation and gap mapping — detects competitor density bands and underserved sub-areas across an area.
- Market Opportunity Index — a 0-100 read of how attractive a category and area is to enter or invest in.
- Geo-grid rank — reports a focal business's rank at every point on a grid and an aggregate Share of Local Voice with a grade.
- Business archetypes — labels each business rising, market-leader, established-steady, fading, new-entrant, at-risk, closed, or unclassified.
- Reranking — order by opportunity, competitive position, momentum, rating, reviews, or recency.
Tracking change
- Competitor Movers — surfaces the biggest momentum and rating moves in an area.
- Signal events — detects review-velocity surges and drops, rating shifts, new entrants, emerging competitors, closures, and market-level shifts.
- Watchlist deltas — re-run with a name and get only what changed: new competitors, closures, rating moves, rank changes.
- Market Feed — flattens events into an importance-ranked stream for Slack, Zapier, or an agent.
- Recurring reports — a weekly, monthly, or quarterly market brief on an Apify schedule.
Remembering it
- Market Memory — records a timestamped public snapshot of every business and market a run touches, building openings, closures, and trajectory over time.
- Business Replay — returns a single business's full tracked story.
- Client Report — a templated, client-ready market-intelligence report built from scores and evidence, no AI narration in the loop.
- Output profiles — signals (full intelligence), compat (exact raw Maps fields), or minimal.
Google Maps market intelligence: use cases by buyer
Built first for local SEO agencies and multi-location brands: the teams that run a market every week and hand a client or a manager the result. Site-selection, investor, and SMB use cases run on the same engine.
Best for local SEO agencies
Use when an agency needs to track clients' and competitors' rank, ratings, and review velocity by area. Used by local-SEO teams to replace weekly CSV diffing with a watchlist feed and a client-ready report. Key outputs: geo-grid rank, Share of Local Voice, Competitor Movers, Client Report.
Best for multi-location brands and franchises
Use when benchmarking locations, monitoring competitors per metro, and picking expansion sites. Key outputs: market concentration, chain presence, Underserved-Area Radar, per-location rank.
Best for site selection and real estate — finding where to open a business
Use when answering where a category is underserved across an area. Key outputs: Underserved-Area Radar, Market Opportunity Index, saturation map, gap areas.
Best for investors and analysts
Use when assessing local market dynamics and roll-up targets. Key outputs: market concentration, market state, new-entrant and closure detection, market momentum.
Best for SMB owners
Use when a single business wants to know how it compares to local competitors and where it is invisible on the map. Key outputs: geo-grid rank, competitive position score, defensibility score, competitor themes.
When to use Google Maps Scraper for competitor analysis
Best for: weekly competitor and rank monitoring for one or many markets, one-off saturation checks before entering a category, site-selection scans across an area, and recurring client reporting. Not ideal for: building contact or email lists (use Google Maps Email Extractor or Google Maps Lead Enricher instead), or pulling raw reviews at depth (use Google Maps Reviews Scraper).
How to check local market saturation on Google Maps
- Enter a category and location — for example
searchTerms: ["dentist"]andlocation: "Austin, TX". - Pick a mode — leave
modeonmarketfor a saturation and opportunity read, or pickgeo_gridfor rank tracking. SetrankBytoopportunityto surface the best openings first. - Run the actor — click Start. A single market read returns in a few minutes.
- Download results — open the Market Overview view, then switch to deeper views. Export as JSON, CSV, or Excel from the Dataset tab.
First run tips
- Start with one market — run a single category and location before scaling to many; confirm the read looks right first.
- Market history starts empty — your first run of a market has no trajectory or rank-over-time yet. Re-run the same market (a watchlist makes this one step) to build openings, closures, and momentum.
- Set an
areafor big markets — a category in a large metro can exceed what one map screen returns. Add anareacircle or polygon to read wider than a single screen. - Use a watchlist for tracking — set
watchlistNameso re-runs return only what changed instead of the full market each time. - Use compat to migrate — set
outputProfile: compatto get the exact field set of the leading Maps scraper for a drop-in swap.
Input parameters
| Parameter | Type | Required | Default | Description |
|---|---|---|---|---|
searchTerms | array | Yes | ["dentist"] | Category or keywords to read the market for. In geo_grid mode these are the keywords to rank for. |
location | string | Yes | "Austin, TX" | City, area, or postcode to center the search on. |
mode | string | No | market | market, competitors, geo_grid, places, watchlist, or replay. |
rankBy | string | No | opportunity | opportunity, competitivePosition, momentum, rating, reviews, or recency. |
outputProfile | string | No | signals | signals (full intelligence), compat (raw Maps fields), or minimal. |
intent | string | No | — | Shortcut: assess_market, track_competitors, site_selection, or monitor_client. |
outputPack | string | No | — | Branded preset: agency_audit, client_monitor, site_selection, franchise_rollout, investor_scan, or raw_compat. |
focalBusiness | string | No | — | For competitors / geo_grid: the business to track (name, URL, or place ID). |
places | array | No | — | For places / replay: business names, URLs, place IDs, or feature IDs. |
grid | object | No | { size: 5, spacingMeters: 800, rankDepth: 20 } | Geo-grid layout for geo_grid mode. |
area | object | No | {} | Polygon, multipolygon, or circle to read wider than one map screen. |
filters | object | No | {} | minStars, hasWebsite, skipClosed, category, priceBracket. |
alerts | object | No | {} | minOpportunityScore, newCompetitorAlert, ratingDropAlert, severity. |
watchlistName | string | No | — | Name a watchlist to track this market over time. |
reportFrequency | string | No | — | weekly, monthly, or quarterly recurring brief. |
enableMarketMemory | boolean | No | true | Record snapshots so history accumulates. |
limits | object | No | {} | maxPlaces, maxReviewsPerPlace, reviewSamplePlaces. |
language | string | No | en | Two-letter language code for Maps results. |
proxyConfiguration | object | No | residential | Proxy configuration; residential is recommended. |
Input examples
- Read a market:
{ "mode": "market", "searchTerms": ["dentist"], "location": "Austin, TX", "rankBy": "opportunity" } - Track rank across the map:
{ "mode": "geo_grid", "focalBusiness": "Smile Dental Austin", "searchTerms": ["dentist"], "location": "Austin, TX", "grid": { "size": 7, "spacingMeters": 1000, "rankDepth": 20 } } - Drop-in raw extraction:
{ "mode": "market", "searchTerms": ["coffee shop"], "location": "Portland, OR", "outputProfile": "compat" }
Input tips
- Leave the defaults —
marketmode withrankBy: opportunitycovers most first reads. - Use
areafor large metros — add a circle or polygon when one map screen would miss the long tail. - Batch markets in one schedule — pair a watchlist with
reportFrequencyto track a market hands-off.
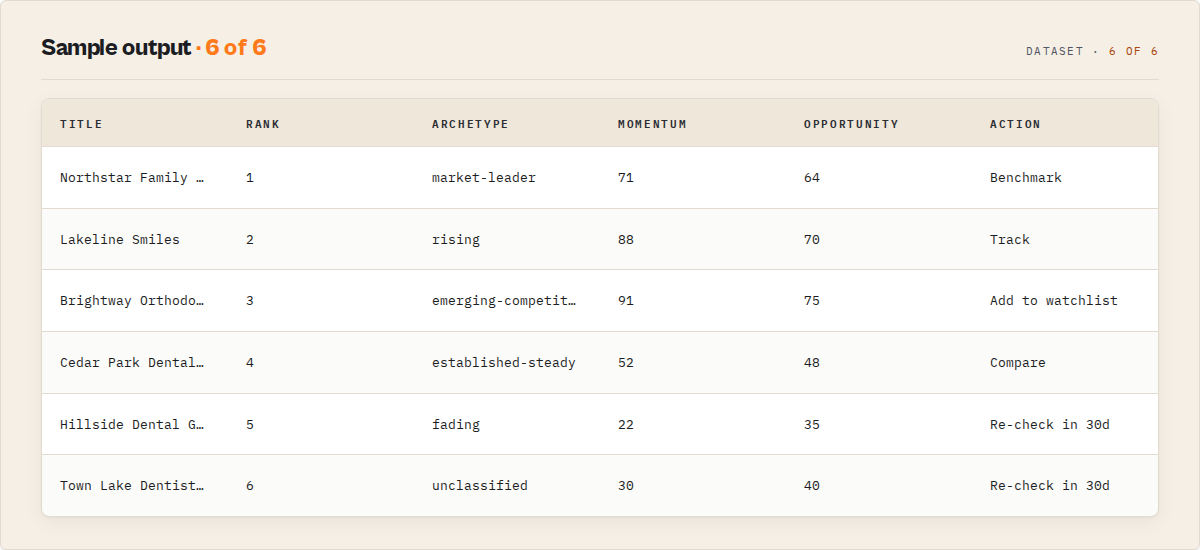
Output example
{
  "recordType": "place",
  "title": "Northstar Family Dental",
  "placeId": "ChIJN1t_tDeuEmsRUsoyG83frY4",
  "categoryName": "Dentist",
  "address": "1200 Pinnacle Ave, Austin, TX",
  "location": { "lat": 30.27, "lng": -97.74 },
  "totalScore": 4.3,
  "reviewsCount": 218,
  "permanentlyClosed": false,
  "rank": 7,
  "signalProfile": { "label": "rising", "strength": 0.71, "evidence": ["Review velocity up vs its 90-day baseline"] },
  "signalEvents": [{ "type": "review_velocity_surge", "active": true, "reason": "Gaining review momentum vs baseline" }],
  "scores": {
    "competitivePositionScore": 64,
    "defensibilityScore": 58,
    "momentumScore": 73,
    "saturationScore": 81,
    "confidence": { "grade": "medium", "coveragePct": 88, "limitations": ["first run: no historical rank yet"] }
  },
  "attention": { "attentionPriority": "high", "whyNow": ["Climbing the grid rank, rating stable"], "recommendedAction": "Track" },
  "whyThisMatters": ["Review velocity up vs its 90-day baseline, gaining fast"],
  "reviewSynthesis": { "sentiment": { "positive": 0.72, "negative": 0.11, "neutral": 0.17 }, "themes": [{ "label": "friendly staff", "weight": 0.4 }], "complaintThemes": [{ "label": "parking", "weight": 0.2 }], "confidenceBand": "medium" },
  "history": { "daysTracked": 0, "trajectory": "flat", "firstSightFallback": true }
}
Output fields
| Field | Type | Description |
|---|---|---|
recordType | string | Discriminator: marketOverview, place, competitor, competitorMover, opportunityArea, geoGridPoint, geoGridSummary, businessReplay, marketIndex, marketCard, event, marketFeed, marketSnapshot, clientReport, coverage, summary, or error. |
title | string | Business name. |
placeId | string | Google's canonical place ID. |
categoryName | string | Primary category as listed on Maps. |
address | string | Street address as listed on Maps. |
location | object | Latitude and longitude of the business. |
totalScore | number | Star rating. |
reviewsCount | number | Number of reviews. |
permanentlyClosed | boolean | Passed through as Maps reports it. |
rank | number | Position in the market result list. |
signalProfile | object | Business archetype, strength, and evidence. |
signalEvents | array | Detected market movements on this business. |
scores | object | Competitive position, defensibility, momentum, saturation, gaps, and data-quality confidence. |
attention | object | Priority, why-now, and a recommended next step. |
whyThisMatters | array | Plain-English lines on why the business warrants attention. |
reviewSynthesis | object | Sentiment, themes, and complaint themes (no personal data). |
history | object | Tracked rating, review, and rank trajectory from market history. |
marketOpportunityIndex | number | 0-100 market attractiveness (market records). |
localVisibilityShare | object | Share of Local Voice from the geo-grid (geo_grid records). |
focalRank | number | Focal business rank at a grid point (geoGridPoint records). |
delta | object | What changed since the last watchlist run. |
coverage | object | What the run requested, scraped, and skipped. |
What data points you get per business
| Data point | Source | Availability | Example |
|---|---|---|---|
| Business name | Google Maps listing | Always | Northstar Family Dental |
| Place ID | Google Maps | Always | ChIJN1t_tDeuEmsRUsoyG83frY4 |
| Rating | Google Maps | When listed | 4.3 |
| Reviews count | Google Maps | When listed | 218 |
| Category | Google Maps | When listed | Dentist |
| Address | Google Maps | When listed | 1200 Pinnacle Ave, Austin, TX |
| Location | Google Maps | When listed | 30.27, -97.74 |
| Permanently closed | Google Maps | Passed through | false |
| Rank in market | Computed | Always | 7 |
| Signal profile (archetype) | Computed | When enough signal | rising |
| Opportunity index | Computed | market mode | 68 |
| Focal rank at grid point | Computed | geo_grid mode | 3 |
How much does it cost to read a local market?
Google Maps Scraper uses pay-per-event pricing, so you pay per intelligence unit produced rather than a monthly subscription. Raw place extraction stays competitive with plain Maps scrapers, while the geo-grid, market history, watchlist, and client-report surfaces carry the premium. Platform compute costs are included.
The real cost anchor is the local-SEO platform this replaces: a monthly seat versus a per-run charge. You set a spending limit on the run so a large market can never exceed your cap, and Apify's free tier includes monthly platform credits to test with.
Pricing is being finalised against benchmarked run costs. Check the actor's pricing tab on its Store page for the current per-event rates.
Read a local market using the API
Python
from apify_client import ApifyClient

client = ApifyClient("YOUR_API_TOKEN")

run = client.actor("ryanclinton/google-maps-scraper").call(run_input={
    "mode": "market",
    "searchTerms": ["dentist"],
    "location": "Austin, TX",
    "rankBy": "opportunity",
})

for item in client.dataset(run["defaultDatasetId"]).iterate_items():
    if item.get("recordType") == "marketOverview":
        print(f"Saturation: {item.get('saturationBand')} | Opportunity: {item.get('marketOpportunityIndex')}")
JavaScript
import { ApifyClient } from "apify-client";

const client = new ApifyClient({ token: "YOUR_API_TOKEN" });

const run = await client.actor("ryanclinton/google-maps-scraper").call({
    mode: "market",
    searchTerms: ["dentist"],
    location: "Austin, TX",
    rankBy: "opportunity",
});

const { items } = await client.dataset(run.defaultDatasetId).listItems();
for (const item of items) {
    if (item.recordType === "marketOverview") {
        console.log(`Saturation: ${item.saturationBand} | Opportunity: ${item.marketOpportunityIndex}`);
    }
}
cURL
curl -X POST "https://api.apify.com/v2/acts/ryanclinton~google-maps-scraper/runs?token=YOUR_API_TOKEN" \
  -H "Content-Type: application/json" \
  -d '{ "mode": "market", "searchTerms": ["dentist"], "location": "Austin, TX", "rankBy": "opportunity" }'

curl "https://api.apify.com/v2/datasets/DATASET_ID/items?token=YOUR_API_TOKEN&format=json"
How Google Maps Scraper works
Mental model: category and location → read the market → score every business → map gaps and movers → compare against tracked history → structured output.
Reading the market
Google Maps Scraper searches Maps around the location, scrolls the results, and reads the place pages. It handles markets larger than a single map screen returns when an area circle or polygon is set. Public business data only: name, place ID, category, rating, public review metadata, presence, and hours.
Scoring and mapping
Every business is scored on competitive position, momentum, saturation, and defensibility, and labelled with an archetype. The area is mapped for competitor density bands and underserved sub-areas, and the focal business is ranked across a grid in geo_grid mode. All reads are deterministic, with evidence lines attached, no AI narration in the decision path.
Remembering
With market memory on, the run records a timestamped public snapshot of every business and market it touches. On later runs, that history powers trajectory, new-entrant and closure detection, and watchlist deltas. The history is public business metrics only, capped to a rolling window.
Tips for best results
- Re-run to unlock history — the first run reads today; the trajectory, openings, and closures appear once a market has been read more than once.
- Watchlist your clients' markets — name a watchlist per client and the weekly re-run returns only the change set, ready for a report.
- Tune the grid for rank precision — a larger
grid.sizeand tighterspacingMetersgive a finer rank map at higher cost. - Use
areato beat the screen cap — set a circle or polygon when a metro has more businesses than one map screen returns. - Switch to compat for ingestion — when feeding a data pipeline,
outputProfile: compatreturns the raw place fields without the intelligence layer.
Combine with other Apify actors
| Actor | How to combine |
|---|---|
| Google Maps Reviews Scraper | Pull deep review text for the businesses this actor flags as movers. |
| Google Maps Email Extractor | Add contact data to a market list (use compat output as the input list). |
| Google Maps Lead Enricher | Enrich the businesses in an underserved area into outreach-ready leads. |
| Website Tech Stack Detector | Profile the websites of competitors flagged in a market read. |
| Trustpilot Review Analyzer | Add off-Maps review sentiment to a competitor analysis. |
| Company Deep Research | Build a full intelligence report on a roll-up target found in a market scan. |
Limitations
- Market history starts empty — a market's first run has no trajectory, openings, closures, or rank-over-time yet; these accumulate as the market is re-read.
- Maps result caps — a single map screen returns a limited set; set an
areapolygon to read wider, and check the Coverage view for what was reached. - Descriptive, not predictive — fading, at-risk, and closure labels describe current evidence; they are never a forecast or a solvency verdict.
- Public business data only — no reviewer personal data and no contact or lead-gen output (use a lead-enrichment actor for that).
- Closed status and popular-times — passed through as Google Maps reports them and may lag reality.
- Large markets cost more — a fine geo-grid across a big metro scrapes many points; size the grid and area to your budget.
Integrations
- Zapier — push Market Feed events into a Slack channel or sheet
- Make — route new-competitor alerts into a CRM
- Google Sheets — export a market read or client report
- Apify API — trigger market reads from any pipeline
- Webhooks — fire on run completion or failure
- LangChain / LlamaIndex — feed structured market intelligence to an AI agent
What this does NOT do
An honest scope fence, so expectations are set before the first run.
- It is not a contact or lead-gen tool. It returns public business intelligence, not email addresses or phone-based outreach lists. Contact data is available only as an optional compat add-on; for lead lists, use Google Maps Lead Enricher.
- It does not predict business failure. Fading, at-risk, and closure are descriptive reads backed by review-velocity, presence, and cohort evidence. They are never a claim that a specific business will close, and never a solvency verdict.
- It does not harvest reviewer personal data. Review synthesis is aggregate sentiment and themes; no individual reviewer identities enter the output or the market history.
- It does not invent occupancy or closure. Popular-times and closed-status are passed through as Google Maps reports them, flagged stale where applicable.
Troubleshooting
The first run has no history or trajectory. This is expected. Market memory builds over time; re-run the same market (a watchlist makes this one step) and trajectory, openings, and closures will appear.
My market looks smaller than it should. A single map screen caps how many businesses return. Set an area circle or polygon to read wider, and check the Coverage view to see what was reached and whether a cap was hit.
Rank fields are null in geo_grid mode. A null focalRank means the focal business did not appear in the top results at that grid point. Increase grid.rankDepth to look deeper, or confirm the focalBusiness name or place ID is correct.
I only want raw place data. Set outputProfile: compat for the exact field set of a plain Maps scraper, without the intelligence layer.
Responsible use
- Google Maps Scraper extracts publicly available business data from Google Maps. It does not bypass authentication, CAPTCHAs, or access restricted content, and it does not harvest reviewer personal data.
- Users are responsible for ensuring their use complies with applicable laws and platform terms, including data protection regulations in their jurisdiction.
- Do not use extracted data for spam, harassment, or unauthorized purposes.
- For guidance on web scraping legality, see Apify's guide.
FAQ
What is the difference between a plain Google Maps scraper and Google Maps Scraper? A plain scraper hands you place rows to interpret yourself. Google Maps Scraper adds the decision layer: saturation, gaps, competitor movement, map rank, and the market history behind them.
Can I use this to check if a local market is saturated? Yes. Run market mode with a category and location; the Market Overview returns a saturation band and a market state in a single run.
Can I track where my business ranks across the map? Yes. Geo-grid mode reports the focal business's rank at every point on a grid and rolls it into a Share of Local Voice score; re-run it for rank over time.
How do I find an underserved area to open a new location? Run market mode with rankBy: opportunity and open the Underserved-Area Radar, which ranks sub-areas by opportunity score.
How does the market history work? With market memory on, each run records a timestamped public snapshot of the businesses and market it touches, so openings, closures, and rating trajectory accumulate. The first run has no history; it compounds with use.
What does the watchlist do? Re-running with the same watchlistName returns only what changed since the last run: new competitors, closures, rating moves, and rank changes, plus a briefing you can hand to a client.
Does this actor predict whether a business will close? No. Fading, at-risk, and closure labels are descriptive reads backed by evidence, never a forecast or a verdict about a specific business.
Can I get the same fields as the Maps scraper I currently use? Yes. Set outputProfile: compat to return the exact place field set for a drop-in migration or raw ingestion.
Is this a contact or lead-generation tool? No. It returns public business intelligence, not contact lists. For outreach-ready leads, use Google Maps Lead Enricher; contact data is available here only as an optional compat add-on.
Is it a practical alternative to a monthly local-SEO subscription? For agencies that mainly need the rank grid, competitor tracking, and client reports, Google Maps Scraper produces those on a per-run basis rather than a monthly seat.
How much does it cost? Pay-per-event. Raw extraction stays competitive with plain Maps scrapers; the geo-grid, history, watchlist, and report surfaces carry the premium. Set a run spending limit to cap any single run.
Is it legal to scrape Google Maps business data? This actor reads publicly available business listings only. Legality depends on your jurisdiction and intended use, so consult legal counsel for your specific case; see Apify's guide on scraping legality linked above.
Help us improve
If you encounter issues, you can help us debug faster by enabling run sharing in your Apify account:
- Go to Account Settings > Privacy
- Enable Share runs with public Actor creators
This lets us see your run details when something goes wrong, so we can fix issues faster. Your data is only visible to the actor developer, not publicly.
Support
Found a bug or have a feature request? Open an issue in the Issues tab on this actor's Store page. For custom solutions or enterprise integrations, reach out through the Apify platform.
Related actors
AI Cold Email Writer — $0.01/Email, Zero LLM Markup
Generates personalized cold emails from enriched lead data using your own OpenAI or Anthropic key. Subject line, body, CTA, and optional follow-up sequence — $0.01/email, zero LLM markup.
AI Outreach Personalizer — Emails with Your LLM Key
Generate personalized cold emails using your own OpenAI or Anthropic API key. Subject lines, opening lines, full bodies — tailored to each lead's role, company, and signals. $0.01/lead compute + your LLM costs. Zero AI markup.
B2B Lead Generation Suite - Find Emails, Score & Qualify Leads
All-in-one B2B lead pipeline. Enter company URLs, get enriched leads with emails, phone numbers, contacts, email patterns, quality scores (0-100), grades, and business signals from a 3-step automated pipeline.
B2B Lead Qualifier - Score & Rank Company Leads
B2B lead scoring tool and API that scores companies 0-100 from 30+ website signals. 5 scoring categories, 4 profiles (sales, marketing, recruiting, default). Plain-English explanations, hiring detection, industry classification, score change tracking. $0.15/lead, no subscription.
Ready to try Google Maps Scraper — Rank Tracking & Market Intelligence?
Run it on your own Apify account. Apify offers a free tier with $5 of monthly credits.
Open on Apify Store